Missing data
NaN, None, pd.NA, and the three different ways your data can be "missing." How to detect, drop, fill, and interpolate it without lying to yourself.
Written and reviewed by Shreyash Prashu Last reviewed
What you'll learn
- The differences between
NaN,None, andpd.NA - Detecting missing values with
isna/notna - Dropping rows or columns with
dropna(and thethreshargument) - Filling and interpolating — and when each is the right call
Before you start
The last lesson assumed every cell held a value. Real data is full of holes — a sensor drops a reading, a user skips a form field, a join finds no match — and a hole is not a zero. Pandas has solid tools for handling missing data, but they will mislead you unless you first ask the question nobody wants to: why is this value missing? Fill a truly-absent sensor reading with 0 and you poison your average; treat “unknown region” as missing and you may drop your biggest customer segment. This lesson is detect, drop, fill, interpolate — without lying to yourself.
NaN vs None vs pd.NA
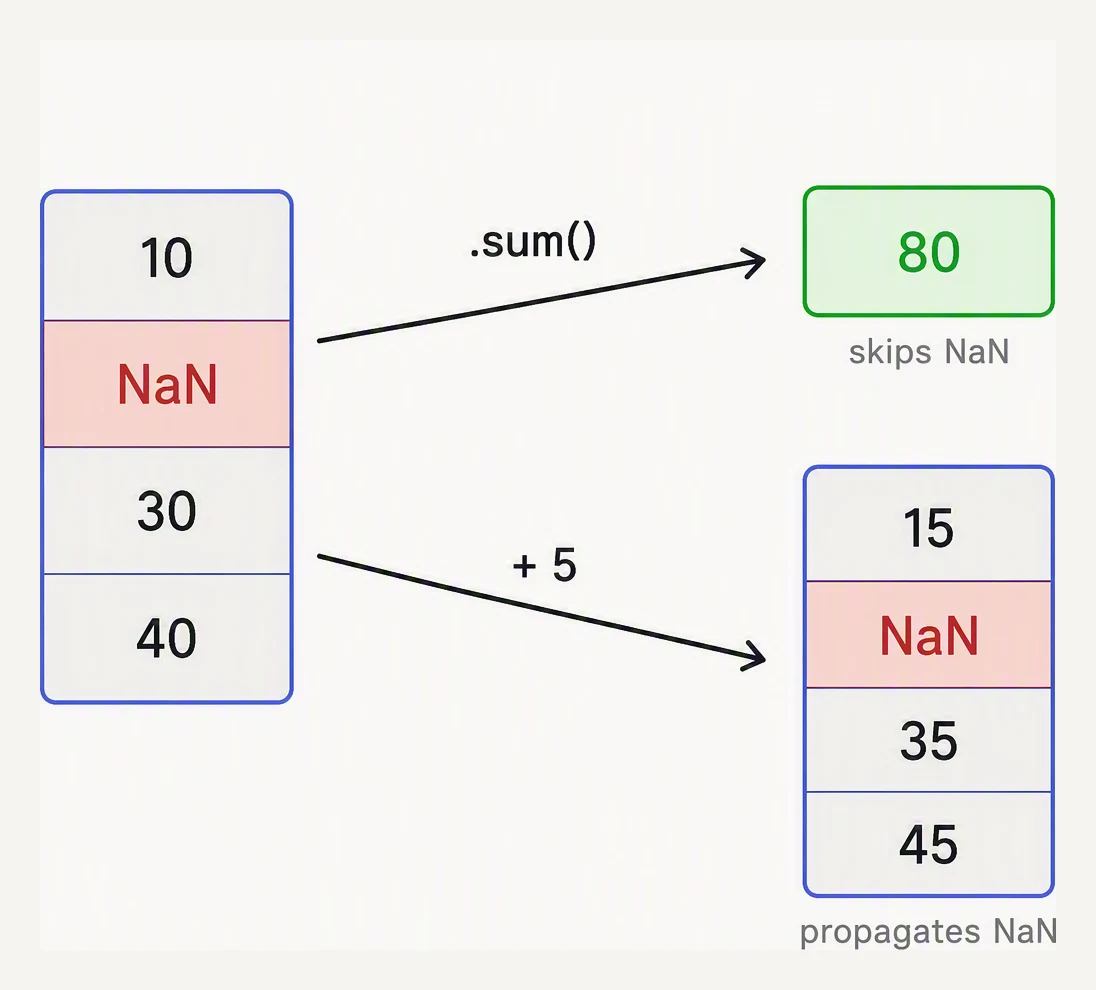
Aggregations skip NaN. Element-wise arithmetic spreads it.
Three flavours, all meaning “missing”:
np.nan— a special floating-point value. Lives in float columns. Comparisons returnFalse(nan != nan).None— Python’s null. Lives in object/string columns. In recent pandas, often converted tonp.nanorpd.NA.pd.NA— the newer “missing” scalar that works across all dtypes. Used by pandas’ nullable types ("Int64","string","boolean").
import pandas as pd
import numpy as np

# Old-style float column — uses NaN
s_float = pd.Series([1.0, np.nan, 3.0])
print("float:", s_float.dtype, s_float.tolist())

# Nullable Int — uses pd.NA, integer dtype preserved
s_int = pd.Series([1, None, 3], dtype="Int64")
print("nullable int:", s_int.dtype, s_int.tolist())

# String column with nullable dtype
s_str = pd.Series(["a", None, "c"], dtype="string")
print("string:", s_str.dtype, s_str.tolist())

# All three are detected by isna()
print()
print(s_float.isna().tolist())
print(s_int.isna().tolist())
print(s_str.isna().tolist())
float: float64 [1.0, nan, 3.0]
nullable int: Int64 [1, <NA>, 3]
string: string ['a', <NA>, 'c']
[False, True, False]
[False, True, False]
[False, True, False]Three dtypes, three different missing sentinels (nan, <NA>, <NA>) — and .isna() finds all
of them identically. The takeaway: always use .isna() / .notna(), never == nan. A == np.nan
test returns False everywhere, because NaN != NaN is baked into the IEEE 754 standard (the
numerical-stability lesson’s world, surfacing in pandas).
”Missing” can mean three different things
This is the part people skip and regret.
- Truly missing — no data was recorded. A null in your sensor stream.
- Zero — data was recorded and the value really is zero. A user with no purchases.
- Unknown — data was recorded but the source didn’t know. A user’s region marked ”?”.
In a CSV all three look identical (an empty cell), yet they mean different things. Filling a “truly missing” sensor reading with 0 will drag down your average; treating “unknown region” as missing might delete your biggest customer segment.
Detecting it
import pandas as pd
import numpy as np

# Hourly temperature readings from a sensor, with some gaps
readings = pd.DataFrame({
    "ts": pd.date_range("2026-05-27", periods=8, freq="h"),
    "temp_c":   [21.1, 21.3, np.nan, 21.8, np.nan, np.nan, 22.4, 22.6],
    "humidity": [45,   46,   47,     np.nan, 49,     50,    np.nan, 52],
})
print(readings)
print()

# Where are the holes?
print("isna per column:")
print(readings.isna().sum())          # how many missing per column

# Which rows have ANY missing?
print()
print(readings[readings.isna().any(axis=1)])
ts temp_c humidity
0 2026-05-27 00:00:00 21.1 45.0
1 2026-05-27 01:00:00 21.3 46.0
2 2026-05-27 02:00:00 NaN 47.0
3 2026-05-27 03:00:00 21.8 NaN
4 2026-05-27 04:00:00 NaN 49.0
5 2026-05-27 05:00:00 NaN 50.0
6 2026-05-27 06:00:00 22.4 NaN
7 2026-05-27 07:00:00 22.6 52.0
isna per column:
ts 0
temp_c 3
humidity 2
dtype: int64
ts temp_c humidity
2 2026-05-27 02:00:00 NaN 47.0
3 2026-05-27 03:00:00 21.8 NaN
4 2026-05-27 04:00:00 NaN 49.0
5 2026-05-27 05:00:00 NaN 50.0
6 2026-05-27 06:00:00 22.4 NaNisna().sum() is the very first thing to run on any new dataset — here, 3 missing temperatures and 2
missing humidities. If a column comes back 90% missing, you have a data-quality problem, not a
“fill it in” problem.
Dropping
import pandas as pd
import numpy as np

readings = pd.DataFrame({
    "ts": pd.date_range("2026-05-27", periods=6, freq="h"),
    "temp_c":   [21.1, 21.3, np.nan, 21.8, np.nan, 22.6],
    "humidity": [45,   46,   47,     np.nan, 49,    52],
})

print("Drop rows with ANY missing:")
print(readings.dropna())
print()

print("Drop rows where ALL columns are missing:")
print(readings.dropna(how="all"))
print()

print("Keep rows with at least 3 non-null values:")
print(readings.dropna(thresh=3))
print()

# Drop a column that's mostly missing
print("Drop columns with any missing:")
print(readings.dropna(axis=1))
Drop rows with ANY missing:
ts temp_c humidity
0 2026-05-27 00:00:00 21.1 45.0
1 2026-05-27 01:00:00 21.3 46.0
5 2026-05-27 05:00:00 22.6 52.0
Drop rows where ALL columns are missing:
ts temp_c humidity
0 2026-05-27 00:00:00 21.1 45.0
1 2026-05-27 01:00:00 21.3 46.0
2 2026-05-27 02:00:00 NaN 47.0
3 2026-05-27 03:00:00 21.8 NaN
4 2026-05-27 04:00:00 NaN 49.0
5 2026-05-27 05:00:00 22.6 52.0
Keep rows with at least 3 non-null values:
ts temp_c humidity
0 2026-05-27 00:00:00 21.1 45.0
1 2026-05-27 01:00:00 21.3 46.0
5 2026-05-27 05:00:00 22.6 52.0
Drop columns with any missing:
ts
0 2026-05-27 00:00:00
1 2026-05-27 01:00:00
2 2026-05-27 02:00:00
3 2026-05-27 03:00:00
4 2026-05-27 04:00:00
5 2026-05-27 05:00:00Watch how much each knob throws away: plain dropna() kept only the 3 fully-complete rows;
how="all" kept everything (no row was entirely empty); thresh=3 (≥ 3 non-nulls) again kept the
3 complete rows; and axis=1 nuked both data columns, leaving just ts. The knobs:
axis=0(default) drops rows;axis=1drops columns.how="any"(default) drops if any value is missing;how="all"only if every one is.thresh=Nkeeps rows/columns with at least N non-null values.subset=["col1"]only considers those columns.
dropna (like most pandas methods) returns a new DataFrame — it does not modify in place.
Write df = df.dropna(...) to keep the result.
Filling
import pandas as pd
import numpy as np

readings = pd.DataFrame({
    "ts": pd.date_range("2026-05-27", periods=6, freq="h"),
    "temp_c":   [21.1, np.nan, np.nan, 21.8, np.nan, 22.6],
})

# Literal value
print(readings.fillna({"temp_c": 0}))     # WRONG for temperatures — but shown for the API
print()

# Forward fill — carry the last known value forward
print("ffill:")
print(readings.ffill())
print()

# Backward fill — pull the next known value back
print("bfill:")
print(readings.bfill())
print()

# Per-column fillna — use the column mean
print("fill with column mean:")
print(readings.fillna({"temp_c": readings["temp_c"].mean()}))
ts temp_c
0 2026-05-27 00:00:00 21.1
1 2026-05-27 01:00:00 0.0
2 2026-05-27 02:00:00 0.0
3 2026-05-27 03:00:00 21.8
4 2026-05-27 04:00:00 0.0
5 2026-05-27 05:00:00 22.6
ffill:
ts temp_c
0 2026-05-27 00:00:00 21.1
1 2026-05-27 01:00:00 21.1
2 2026-05-27 02:00:00 21.1
3 2026-05-27 03:00:00 21.8
4 2026-05-27 04:00:00 21.8
5 2026-05-27 05:00:00 22.6
bfill:
ts temp_c
0 2026-05-27 00:00:00 21.1
1 2026-05-27 01:00:00 21.8
2 2026-05-27 02:00:00 21.8
3 2026-05-27 03:00:00 21.8
4 2026-05-27 04:00:00 22.6
5 2026-05-27 05:00:00 22.6
fill with column mean:
ts temp_c
0 2026-05-27 00:00:00 21.100000
1 2026-05-27 01:00:00 21.833333
2 2026-05-27 02:00:00 21.833333
3 2026-05-27 03:00:00 21.800000
4 2026-05-27 04:00:00 21.833333
5 2026-05-27 05:00:00 22.600000See how each strategy lies differently: fillna(0) slammed three temperatures to a physically absurd
0 °C; ffill held the last real reading (21.1, 21.1, …); bfill pulled the next one back; the
column-mean filled with a flat 21.83. ffill is the right choice for a slowly varying signal
like temperature — the last known value beats zero — and bfill rescues the start of a series where
no prior value exists. (Note: df.fillna(method="ffill") was deprecated in pandas 2.1 and removed
in 3.0 — call df.ffill() / df.bfill() directly.)
Interpolation — smarter than fill
For numeric, ordered data (think time series), interpolation estimates the values between two known endpoints rather than copying one of them:
import pandas as pd
import numpy as np

readings = pd.Series(
    [21.1, np.nan, np.nan, 21.8, np.nan, 22.6],
    index=pd.date_range("2026-05-27", periods=6, freq="h"),
    name="temp_c",
)

print("ffill:")
print(readings.ffill().round(2))
print()

print("linear interpolate:")
print(readings.interpolate().round(2))
print()

print("time-aware interpolate (respects gap sizes):")
print(readings.interpolate(method="time").round(2))
ffill:
2026-05-27 00:00:00 21.1
2026-05-27 01:00:00 21.1
2026-05-27 02:00:00 21.1
2026-05-27 03:00:00 21.8
2026-05-27 04:00:00 21.8
2026-05-27 05:00:00 22.6
Freq: h, Name: temp_c, dtype: float64
linear interpolate:
2026-05-27 00:00:00 21.10
2026-05-27 01:00:00 21.33
2026-05-27 02:00:00 21.57
2026-05-27 03:00:00 21.80
2026-05-27 04:00:00 22.20
2026-05-27 05:00:00 22.60
Freq: h, Name: temp_c, dtype: float64
time-aware interpolate (respects gap sizes):
2026-05-27 00:00:00 21.10
2026-05-27 01:00:00 21.33
2026-05-27 02:00:00 21.57
2026-05-27 03:00:00 21.80
2026-05-27 04:00:00 22.20
2026-05-27 05:00:00 22.60
Freq: h, Name: temp_c, dtype: float64Compare the columns: ffill gives a step function (21.1, 21.1, 21.1, then jumps), while
interpolate draws a smooth ramp (21.10 → 21.33 → 21.57 → 21.80) — far truer to how temperature
actually moves. Reach for method="time" when your index is a DatetimeIndex with uneven gaps, so
a two-hour hole is filled differently from a one-hour hole.
Don’t fill without thinking
The whole lesson in one table: four ways to handle missing sales, four different averages.
import pandas as pd
import numpy as np

daily_sales = pd.Series(
    [120, np.nan, np.nan, 210, 175, np.nan, 200],
    name="units",
)

print("with NaN:                ", daily_sales.mean().round(1))
print("fill 0   (treat as zero):", daily_sales.fillna(0).mean().round(1))
print("fill mean (impute):       ", daily_sales.fillna(daily_sales.mean()).mean().round(1))
print("drop missing:             ", daily_sales.dropna().mean().round(1))
with NaN: 176.2
fill 0 (treat as zero): 100.7
fill mean (impute): 176.2
drop missing: 176.2Same seven numbers, but fillna(0) reports an average of 100.7 while the other three say
176.2. The “right” answer depends entirely on what the missing values mean: were the stores
closed (then 0 is honest), did the export glitch (then drop or impute), or did stores open late (then
neither)? Note that .mean() already skips NaN — so “with NaN” and “drop” agree, and imputing the
mean cannot change the mean. Zero-filling is the only choice that moves the number, and it moves it
by lying.
Every fill strategy distorts the data differently
25 rows of sensor readings — white cells are present values, dark gaps are missing. Toggle a strategy to see which cells get filled (tinted) or which rows get dropped, and read how each choice biases downstream analysis.
No strategy applied — missing cells are gaps. Analyses on this frame will silently ignore them.
In one breath
Missingness comes as np.nan (float), None (object), or pd.NA (nullable dtypes) —
detect all of them with .isna()/.notna(), never == nan (which is always False). First ask
why it’s missing: truly-absent, genuinely-zero, or unknown — they look identical but demand
different handling. dropna removes rows/cols (axis, how="any"/"all", thresh=N, subset);
fillna plugs a value (literal, or a per-column dict); ffill/bfill carry the
last/next known value; interpolate (smarter for ordered/time data) draws a smooth ramp between
endpoints (method="time" for uneven gaps). All return new objects. And .mean() already skips
NaN — so the only “fill” that distorts a mean is filling with the wrong constant (the
fillna(0) → 100.7 vs 176.2 trap).
Practice
Quick check
df[df['x'] == np.nan] return zero rows even when x has NaNs?df.dropna(thresh=3) does what?clean = df.dropna() then inspect df. What do you see?A question to carry forward
You can now read a file, select any slice of it, and clean its holes — the data is finally trustworthy. But a clean table is not yet an answer. The questions that pay the bills are almost always per group: revenue per region, average session length per user, conversion per campaign. Computing those by hand — filter to each group, aggregate, stitch the pieces back together — is exactly the loop you never want to write.
Pandas has one verb that does all three at once, and it powers more production pipelines than any
other: groupby. What is the split–apply–combine pattern, how do you aggregate one or many
columns in a single call, and why is groupby the moment pandas stops being a spreadsheet and starts
behaving like a database?
Practice this in an interview
All questionsisna/notna detect missing values; dropna removes rows or columns containing them; fillna replaces them with a scalar, dict, or forward/backward fill; interpolate estimates values from neighboring points using a chosen method. The right strategy depends on whether missingness is random, structural, or time-ordered.
Missing data can be dropped, imputed with a statistic (mean, median, mode), or imputed with a model. The right choice depends on the missing mechanism (MCAR, MAR, MNAR), the fraction of missing data, and the downstream model. Dropping rows is only safe when missingness is rare and random; imputation must always be fit on training data only.
The .str accessor vectorizes Python string methods across a Series without a Python-level loop, propagates NaN automatically, and integrates cleanly into method chains. Calling apply(lambda x: x.upper()) does the same work slower and breaks on NaN unless you add a null check.
duplicated() returns a boolean mask of rows that are duplicates of an earlier row; dropduplicates() removes them. Both accept a subset parameter to restrict comparison to specific columns and a keep parameter ('first', 'last', or False) to control which instance is retained or whether all copies are dropped.