The narrative arc of a chart
Every chart should carry ONE clear message. Learn to write takeaway titles, structure setup-insight-implication sequences, and turn technically correct charts into decision-changing stories.
What you'll learn
- How a takeaway title converts a data dump into a decision tool
- The three-act structure: set context, reveal tension, point to action
- Exploratory vs explanatory visualization — and why mixing them costs you the room
Before you start
The last lesson made sure you pick the chart that answers your question. But a correct chart, dropped raw onto a slide, still just sits there — five numbers the reader has to decode for themselves. This lesson is the next move: turning a correct plot into a story the audience can’t misread.
A chart that shrugs back at its audience has almost always committed the same quiet crime: it showed data instead of telling a story. Data and story are not the same thing. A spreadsheet full of quarterly revenue figures is data. The sentence “Revenue fell 20% in the quarter after the price change” is a story. One demands effort from the reader; the other delivers the work already done.
This lesson is about the craft of the second kind.
One chart, one message
The single most important rule in data storytelling is also the one most frequently broken: every chart should carry exactly one clear message.
When you sit down to design a chart, the first question is not “what chart type should I use?” It is: “what is the ONE thing I want my audience to walk away knowing?” Write that sentence down before you touch the plotting library. Everything else — which variables to encode, which time range to show, which comparison to highlight — flows from that sentence.
If you cannot write the sentence, you are not ready to make the chart. You are still in the exploratory phase (more on that distinction below), and what you need is more analysis, not a better chart.
The takeaway title
The fastest, highest-leverage change you can make to any existing chart is to rewrite its title. Most chart titles are topic titles: they name the data.
- “Quarterly Revenue”
- “User Retention by Cohort”
- “Model Accuracy vs Training Size”
Topic titles make the reader do all the interpretive work. They look at the chart, extract the pattern, form an opinion, and — most dangerously — may form a different opinion than the one you intended.
A takeaway title does the work for the reader. It states the conclusion.
- “Revenue fell 20% in the quarter after the price change”
- “Cohorts acquired after the redesign retain 15 pp higher at 90 days”
- “Accuracy plateaus above 50 k training examples — more data won’t help”
The takeaway title is not spin. The data still has to support it. But it removes ambiguity and guides attention. In a board meeting or a product review, the title is often the only sentence that gets read before the next slide appears. Make it count.
The three-act narrative structure
Good data stories follow a structure that will feel familiar because it is the same one used in almost every other form of human communication: setup, tension, resolution. Applied to visualization, this becomes:
-
Set the context. What is the baseline? What should be true, or what was true before? Give the audience just enough background to understand why what comes next is surprising or important.
-
Reveal the insight or tension. This is your one message. Something changed, something diverged, something is not what we expected. The highlighted data point, the annotated spike, the line that breaks away from the others — this is the moment the chart exists to deliver.
-
Point to the implication or action. So what? If the insight is that retention improved after a redesign, the implication is that rolling the redesign out to the remaining cohorts is worth prioritizing. The chart doesn’t always have to carry this text — a single annotation or a caption can do it — but it should be there somewhere.
The diagram below maps this structure onto the anatomy of a single “story chart.”
Anatomy of a story chart. The takeaway title does the interpretive work. The highlighted bar and dashed annotation carry the reader’s eye to the one moment that matters. Context bars are muted so they don’t compete.
Notice what the diagram is doing structurally. The earlier quarters provide context — they establish that revenue was growing, so the drop is surprising. The Q3 2025 bar is highlighted in red while everything else is muted gray, directing the eye without requiring an explanation. The annotation names the cause, completing the arc. And the title states the implication before the viewer has to ask.
Sequencing charts into a story
A single chart can carry one message. A sequence of charts can carry a complete argument. When you have multiple charts to present — a slide deck, a report section, a notebook — think of each chart as one step in a logical progression, where every step earns the right to the next.
A well-sequenced four-chart story might look like this:
- Chart 1 — Set the scene. “Monthly active users have been flat for two quarters.” (Bar or line chart, no highlights, just the baseline.)
- Chart 2 — Introduce the tension. “Acquisition is up — the problem is retention.” (Two lines diverging, acquisition rising, retention falling.)
- Chart 3 — Diagnose the cause. “Day-7 retention dropped sharply for mobile users after the v4 release.” (Cohort lines, mobile highlighted.)
- Chart 4 — Point to the action. “The three screens with the highest early drop-off are all in the new onboarding flow.” (Funnel or ranked bar, top three highlighted.)
Each chart advances one step. The audience is never left wondering “why are you showing me this?” because the previous chart created the question the current one answers.
Know your audience
The same underlying data needs different treatments depending on who is sitting in the room.
An executive audience wants the so-what first. They will not read axes before they understand why they are looking at the chart. Lead with the takeaway title. Make the main point visible in three seconds. Put the supporting detail in a caption or an appendix. Their question is always: “what should I do differently because of this?”
An analyst or technical audience wants to trust the result before they accept it. They will scrutinize the axes, check whether the baseline is zero or truncated, ask about sample sizes and confidence intervals. Give them the detail. Annotate the methodology. Showing the uncertainty is a sign of rigor, not weakness.
Mixing these treatments — detailed axis labels and confidence bands in an executive deck, takeaway-free topic titles in an analyst review — is a common mistake that stems from using the same chart in both contexts. The chart you built for exploration is almost never the chart you should show to decision-makers.
Exploratory vs explanatory visualization
This brings us to the most important conceptual distinction in data communication, and the one that causes the most confusion.
Exploratory visualization is for you. It is the work you do to find the signal — dozens of quick plots, default styles, no titles, ugly axes. The goal is speed and coverage. You are the audience, and you know the context. A messy plot that reveals a surprising pattern in ninety seconds is perfect exploratory visualization.
Explanatory visualization is for them. It is the work you do after you have found the signal and decided it matters. Now you are a communicator, not an analyst. One chart. One message. A takeaway title. A highlighted data point. An annotation. Muted context. This is the chart that changes a decision.
The failure mode that haunts most data presentations is treating exploratory outputs as explanatory deliverables — pasting a raw notebook plot into a slide deck, topic title and all, and expecting the audience to do the interpretive work that you have already done. They won’t, or they’ll do it wrong.
The transition from exploratory to explanatory is a deliberate editorial act. You decide what story the data tells, you build the chart that tells it, and you write the title that states it. That is the work.
A complete story chart in code
The chart below applies all of these ideas in one place: a takeaway title, one highlighted bar, a muted context, and an annotation.
import matplotlib.pyplot as plt

quarters = ["Q3 24", "Q4 24", "Q1 25", "Q2 25", "Q3 25", "Q4 25", "Q1 26"]
revenue  = [4.1, 4.4, 4.8, 5.1, 4.1, 4.3, 4.5]

colors = ["#d1d5db"] * len(quarters)
colors[4] = "#ef4444"   # highlight Q3 25

fig, ax = plt.subplots(figsize=(8, 4.5))

bars = ax.bar(quarters, revenue, color=colors, width=0.6, edgecolor="none")

ax.annotate(
    "Price raised +15%\n(Q3 2025)",
    xy=(4, revenue[4]),
    xytext=(5.2, 4.75),
    arrowprops=dict(arrowstyle="->", color="#ef4444", lw=1.3),
    fontsize=9,
    color="#b91c1c",
    va="center",
)

ax.set_title(
    "Revenue fell 20% in the quarter after the price change",
    fontsize=12,
    fontweight="bold",
    loc="left",
    pad=10,
)
ax.set_ylabel("Revenue ($M)")
ax.set_ylim(0, 6.2)
ax.spines[["top", "right"]].set_visible(False)
ax.tick_params(axis="both", labelsize=9)

# Mute y-axis grid
ax.yaxis.grid(True, color="#f3f4f6", linewidth=0.8)
ax.set_axisbelow(True)

plt.tight_layout()
plt.show()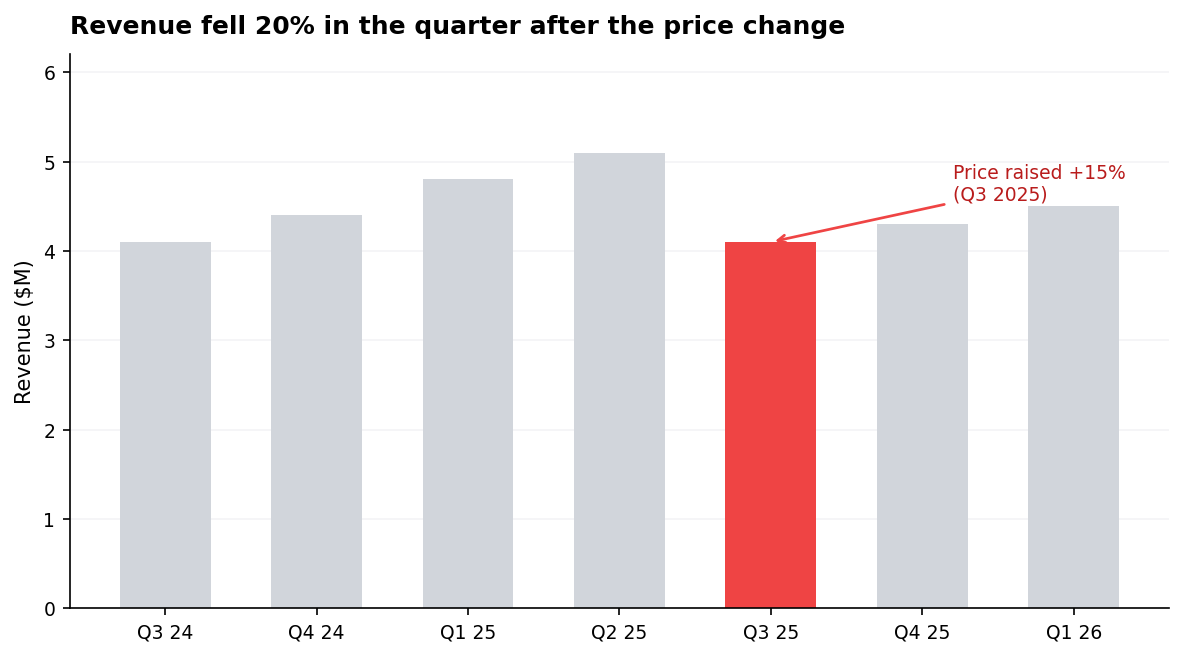
Q2 25’s 5.1 to Q3 25’s 4.1 is the ~20% drop — one red bar, one annotation, a takeaway title doing the interpretive work.
The title is not “Quarterly Revenue.” The highlighted bar is not the same color as the others. The annotation names the cause. The context bars are gray. Every choice is in service of the one message.
In one breath
A chart that “shrugs” showed data instead of telling a story. The fix is editorial. One chart, one message — write the single sentence you want the audience to leave with before you plot; if you can’t, you’re still exploring. Make that sentence the takeaway title (“Revenue fell 20% after the price change”), not a topic title (“Quarterly Revenue”) — it’s often the only line that gets read. Structure the chart as a three-act arc: muted context, one highlighted insight, an annotation pointing to the implication. Sequence several charts so each earns the next. And know the line between exploratory viz (fast, ugly, for you) and explanatory viz (one message, takeaway title, for them) — pasting the first into a deck is the failure that loses the room.
Practice
Quick check
A question to carry forward
We kept giving the same instruction — “highlight the one element, mute the rest, annotate the cause” — and the story chart obeyed it. But how, precisely? Why does one red bar in a field of gray get found before you consciously look? What makes a label placed on the line beat the same label in a legend? Those aren’t taste; they’re how vision works, and they have rules.
So the question to carry forward is: what are the actual mechanics of guiding the eye? The next lesson, annotation and guiding the eye, names the pre-attentive attributes (colour, size, position) the brain processes in under 250 ms, and turns them into concrete techniques — direct labelling, focus colouring, reference lines, and cutting chartjunk to lift the data-ink ratio — so the one thing that matters lands before the viewer has time to think.
Practice this in an interview
All questionsAn effective dashboard places the most critical metric in the top-left, groups related charts into logical sections, uses consistent scales and color across panels, limits the view to 5–9 metrics per screen, and is designed around a single primary question rather than trying to surface everything at once.
Small multiples (also called trellis or facet charts) repeat the same chart structure across panels, one per category, using identical scales, axes, and visual encodings. They let viewers compare patterns across groups without the visual tangle of many overlapping lines or bars, and are the right choice when you have more than three to four groups or when overlap obscures individual trends.
A data story has three components: a clear narrative arc (situation, complication, resolution), charts that each advance one argument rather than display all available data, and deliberate attention direction through annotation, color emphasis, and sequencing. The goal is that a viewer reading only the titles and callouts should understand the conclusion without reading every axis.
Match the chart to the relationship in the data: comparison across categories calls for bars, trends over continuous time call for lines, correlation between two numeric variables calls for a scatter plot, and distribution shape calls for a histogram or box plot. The question you are answering — not aesthetics — drives the choice.