Colour & accessibility for clarity
When should colour encode meaning vs just decorate — and how do I keep charts readable for colourblind viewers?
What you'll learn
- The three palette families: sequential, diverging, and qualitative — and when each applies
- Why colour is an encoding channel, not decoration — and the gray+accent focus principle
- How to keep charts readable for the ~8% of men with colour vision deficiency
Before you start
The last lesson leaned on colour as a reflex — one accent against gray. This final visualization lesson makes that reflex deliberate: which colour, for which kind of data, and readable by everyone — because the choices hiding inside “just pick a colour” are real, and one of them quietly excludes one viewer in twelve.
Colour is the most attention-grabbing encoding channel in data visualisation — and the most commonly misused one. The core mistake is treating colour as decoration: picking shades because they look good, or because the default matplotlib cycle happened to produce them. Colour should always encode a variable or highlight a single series. When it does neither, it adds visual noise without adding information.
There is a second problem layered on top: roughly 8% of men (and about 0.5% of women) have some form of colour vision deficiency (CVD) — the most common being red-green confusion. A chart that looks perfectly clear to you may be unreadable to one person in every twelve in the room.
The fix for both problems is the same: choose palettes that match your data type, and never rely on colour alone to convey meaning.
The three palette families
Every colour scale you will ever need falls into one of three families. Matching the family to your data type is not a style preference — it is a correctness question.
Sequential encodes magnitude from low to high. Diverging encodes deviation from a meaningful midpoint. Qualitative distinguishes unordered categories with perceptually distinct hues.
Sequential — ordered magnitude
Use a sequential palette when your data runs from low to high along a single direction: population density, temperature in one season, model confidence score, time elapsed. The palette should go from a light, low-salience colour to a dark, high-salience one (or vice-versa). The eye naturally reads darker-as-more.
Good choices: viridis, plasma, cividis, magma (all
perceptually uniform and CVD-safe). Avoid the classic jet or rainbow
— more on that shortly.
Diverging — deviation from a midpoint
Use a diverging palette when your data has a meaningful midpoint — a value where the interpretation switches direction. Classic examples: temperature anomaly from a baseline year (negative = cooler, positive = warmer); profit margin around zero; model error above and below a target.
The midpoint should map to a neutral, low-salience colour (white or light grey). Each arm should go toward a distinct, saturated hue.
Good choices: coolwarm, RdBu, PuOr. Avoid using red-green
diverging scales (a large fraction of CVD viewers cannot distinguish
them).
Qualitative — unordered categories
Use a qualitative palette when your categories have no natural order: product lines, geographic regions, species, model architectures. Here you want hues that are as distinct as possible so the eye can separate them — not a gradient, which implies an order that does not exist.
Good choices: tab10, Set2, Paired. Keep the number of
categories below about eight — beyond that, human colour discrimination
breaks down and you should switch to labels, patterns, or facets instead.
Colour encodes, not decorates
The key principle to internalize: colour is an encoding channel. In the same way that x-position encodes the independent variable and y-position encodes the response, colour encodes a third variable — or, in the “gray + one accent” focus pattern from the annotation lesson, it highlights the single series that carries the story.
What colour must not do is decorate. Giving each bar in a bar chart a different colour when they all represent the same variable — sales in different months — adds zero information and forces the viewer to build a legend mapping they will immediately discard. It also makes the chart nearly impossible for a CVD viewer to interpret consistently.
Rule of thumb: before you assign a colour, ask “what variable does this colour represent?” If the answer is “nothing — it just looks nice,” use a single neutral colour or the gray-plus-accent pattern instead.
Accessibility: colour vision deficiency
Approximately 8% of men have colour vision deficiency. The most common form is deuteranopia (green-blind) or protanopia (red-blind), which collapse the red-green channel. This means a red-green diverging scale, or a line chart with one red and one green line, is effectively a single-colour chart for a meaningful fraction of your audience.
Three concrete rules:
-
Use CVD-safe palettes by default.
viridisandcividiswere explicitly designed to be distinguishable under deuteranopia, protanopia, and tritanopia, and they print well in greyscale too. -
Never rely on colour alone. Add direct labels to lines, use different marker shapes for scatter series, annotate the interesting bars with their values. A chart that is readable in greyscale is readable for everyone.
-
Ensure sufficient contrast. Light text on a light background, or thin lines in pale colours, fail for CVD viewers and for anyone in a bright room. Matplotlib’s default line width and font sizes are often too small for presentation contexts — increase them.
The gray + accent focus principle
The lesson on annotation and focus introduced the gray + one accent pattern: render all series in a neutral grey and use a single saturated colour only on the series you want the viewer to notice. This is the highest-contrast, most accessible version of colour-as-highlight. It requires no legend, works in greyscale, and is trivially interpretable by CVD viewers because there is no colour comparison to make — there is only “the one coloured thing” and “everything else.”
Use this pattern whenever you are telling a story about one series relative to a field — the best-performing product, the anomalous region, the model that overfit.
Runnable example: viridis heatmap with direct labels
The code below builds a small heatmap using the viridis colormap and
annotates every cell with its value, so the chart is interpretable
without any colour discrimination at all.
import matplotlib.pyplot as plt
import numpy as np

rng = np.random.default_rng(42)
data = rng.uniform(0.1, 0.9, size=(5, 5))

row_labels = ["North", "South", "East", "West", "Central"]
col_labels = ["Q1", "Q2", "Q3", "Q4", "Q5"]

fig, axes = plt.subplots(1, 2, figsize=(11, 4))
fig.suptitle("Same data — jet vs viridis with direct labels", fontsize=13, fontweight="bold")

# --- Left: jet colormap (what NOT to do) ---
ax1 = axes[0]
im1 = ax1.imshow(data, cmap="jet", vmin=0, vmax=1)
ax1.set_xticks(range(5)); ax1.set_xticklabels(col_labels)
ax1.set_yticks(range(5)); ax1.set_yticklabels(row_labels)
ax1.set_title("jet colormap (avoid)", color="firebrick", fontsize=11)
fig.colorbar(im1, ax=ax1, fraction=0.046, pad=0.04)
for i in range(5):
    for j in range(5):
        ax1.text(j, i, f"{data[i, j]:.2f}", ha="center", va="center",
                 fontsize=9, color="black")

# --- Right: viridis colormap + direct annotation ---
ax2 = axes[1]
im2 = ax2.imshow(data, cmap="viridis", vmin=0, vmax=1)
ax2.set_xticks(range(5)); ax2.set_xticklabels(col_labels)
ax2.set_yticks(range(5)); ax2.set_yticklabels(row_labels)
ax2.set_title("viridis + direct labels (accessible)", color="#2d6a4f", fontsize=11)
fig.colorbar(im2, ax=ax2, fraction=0.046, pad=0.04)
for i in range(5):
    for j in range(5):
        val = data[i, j]
        text_color = "white" if val < 0.6 else "black"
        ax2.text(j, i, f"{val:.2f}", ha="center", va="center",
                 fontsize=9, color=text_color, fontweight="bold")

fig.tight_layout()
plt.show()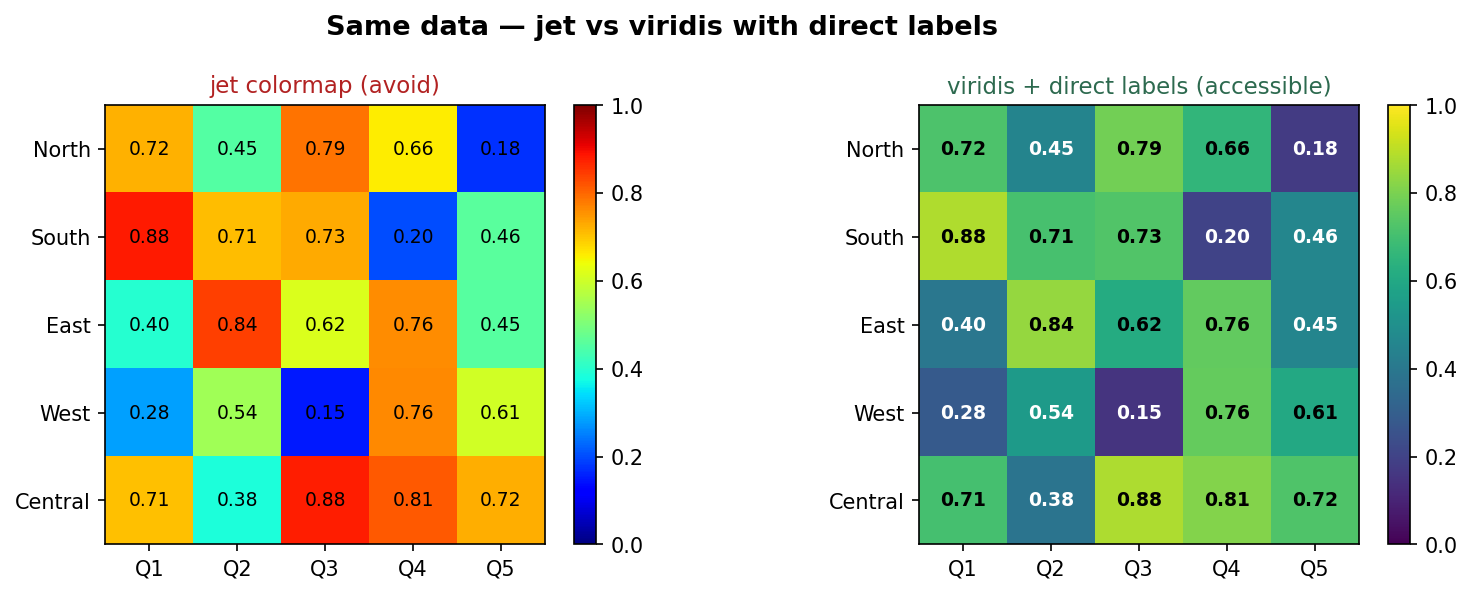
Left: jet invents false boundaries and fails for colour-blind viewers. Right: viridis reads smoothly low→high, and the in-cell labels carry the value with no colour discrimination at all.
Notice what the direct labels on the right panel do: you can remove the colour entirely and the information is still complete. That is the goal. The colour adds a quick visual gradient for viewers who can use it; the labels carry the meaning for everyone else.
In one breath
Colour is an encoding channel, not decoration — every colour should answer “what variable does this
represent?” Match the palette to the data: sequential (viridis, low→high magnitude), diverging
(coolwarm/RdBu, deviation from a meaningful midpoint like zero), or qualitative (tab10, ≤8 unordered
categories). About 1 man in 12 has colour-vision deficiency, so never rely on colour alone — add
direct labels, marker shapes, or patterns so the chart survives grayscale and CVD. Default to
CVD-safe, perceptually-uniform colormaps and retire the rainbow jet, which invents false edges and
collapses under red-green blindness. The most accessible highlight of all is gray-plus-one-accent: no
colour comparison to make, just “the one coloured thing.”
Practice
Quick check
A question to carry forward
That closes the visualization track. Across two dozen lessons you learned to see data — plot it, shape it into a story, colour it for everyone. But notice the quiet assumption under almost every chart we drew: that the rows were interchangeable. A scatter doesn’t care which point came first; a histogram shuffles freely; even our forecasting plots back in business analytics treated each month as a tidy, independent sample.
So the question that opens the next section is: what happens when the order of the rows is the whole point? Sales today depend on sales yesterday; you can’t shuffle a calendar. The next section is time series, and its first lesson — why time series is different — shows how ordered, self-correlated data breaks the assumptions every ordinary model is built on, and the one splitting rule that keeps your forecasts honest.
Practice this in an interview
All questionsAbout 8 % of men have red-green color deficiency, making the default red-green diverging palette unreliable. Use colorblind-safe palettes such as Okabe-Ito or ColorBrewer, match palette type to data type (sequential for ordered magnitudes, diverging for values around a meaningful midpoint, qualitative for unordered categories), and always add a redundant encoding such as shape, pattern, or label.
A data story has three components: a clear narrative arc (situation, complication, resolution), charts that each advance one argument rather than display all available data, and deliberate attention direction through annotation, color emphasis, and sequencing. The goal is that a viewer reading only the titles and callouts should understand the conclusion without reading every axis.
An effective dashboard places the most critical metric in the top-left, groups related charts into logical sections, uses consistent scales and color across panels, limits the view to 5–9 metrics per screen, and is designed around a single primary question rather than trying to surface everything at once.
Match the chart to the relationship in the data: comparison across categories calls for bars, trends over continuous time call for lines, correlation between two numeric variables calls for a scatter plot, and distribution shape calls for a histogram or box plot. The question you are answering — not aesthetics — drives the choice.