Annotation & guiding the eye
How to direct a viewer's attention to the one thing that matters — direct labeling, focus coloring, pre-attentive attributes, and the data-ink ratio.
What you'll learn
- Direct annotation: label the key point on the chart instead of forcing a legend lookup
- Focus coloring: mute everything to gray, give one series the accent color
- Pre-attentive attributes and the data-ink ratio (Tufte) — what to cut so signal shines
Before you start
The last lesson told you what to do — highlight one element, mute the rest, label the cause. This one is the how, and it’s not a matter of taste: it’s grounded in how human vision actually processes a chart in the first quarter-second.
Every chart you publish competes for attention it will rarely get. A viewer in a report has seconds, not minutes. The only way to win that bet is to make the single most important element impossible to miss — and make everything else invisible enough that it stops fighting for attention.
That is not a design preference. It is how vision works.
Why attention needs a guide
Human vision has two modes. The slow, deliberate mode reads labels and traces lines. The fast, automatic mode — operating in under 250 milliseconds before a conscious thought forms — responds to a small set of visual properties called pre-attentive attributes: color, size, orientation, and position. A bright red dot in a field of gray circles is found instantly, without scanning. A bold line among thin ones is found instantly. A tall bar among short ones is found instantly.
Annotation and focus techniques work by exploiting that fast mode. If the viewer’s eye lands on the right element before they have time to think, your message is delivered.
Technique 1: Direct annotation
A legend is a detour. The viewer reads a series label in the legend, remembers the color, scans back to the chart, finds the color, and then forms an interpretation. That is four steps, each with a chance to lose the thread.
Direct annotation removes the detour: place the label directly on or beside the data it describes, exactly where the eye already is.
Rules of thumb for placement:
- Label the final data point of a line, not somewhere in the middle.
- Offset the label slightly (a few pixels up or to the right) so it does not overlap the line.
- If two lines cross and their end labels would collide, label only the one that matters and let the other stay in a minimal legend.
Direct annotation is especially powerful at the key point — the moment in time or the bar that carries the message. Put a short, plain-language phrase there: “Peak: 2.4 M units (Q3 2023)”. That phrase should sound like the sentence you would say aloud when presenting the chart.
Technique 2: Focus coloring
The most reliable focus technique is also the simplest: render every series you are not talking about in a neutral gray (around #AAAAAA or similar), and give the one series you are talking about the single accent color. Nothing else gets that color.
This works because color is a pre-attentive attribute. The eye travels to the accent line before the viewer consciously decides to look there. Gray is not “bad” — it is carrying structural context that makes the accent color meaningful. Remove the gray lines and you lose the comparison that justifies the accent.
Technique 3: Pre-attentive attributes at a glance
Beyond color, these attributes are processed pre-attentively and can direct the eye:
- Size — a thicker line or taller bar is read as more important.
- Position — elements at the top-left of a figure attract the first glance in left-to-right reading cultures.
- Enclosure — a light background band or box around one region isolates it without requiring any color.
- Intensity — a fully opaque element pops against semi-transparent neighbors.
You do not need all of these. One well-chosen attribute is enough. Stacking several creates the same problem as highlighting everything.
Technique 4: Cutting chartjunk and the data-ink ratio
Edward Tufte introduced the concept of chartjunk — visual elements that consume ink without conveying data. Common offenders:
- Heavy grid lines (thin, light gray is nearly always enough)
- 3-D perspective effects (they distort comparisons and add zero information)
- Redundant axis labels when the title already names the variable
- Colored background panels behind the plot area
- Tick marks on every gridline
Tufte’s data-ink ratio captures the goal: for every drop of ink (or pixel) used, ask whether it is carrying data. If it is not, consider removing it. A high data-ink ratio means the chart is dense with information per unit of visual weight.
The practical test: delete each element and ask, “Does the chart lie or become unreadable without this?” If not, delete it.
Technique 5: Reference lines and bands
A reference line — a horizontal line at a target value, average, or regulatory threshold — gives the viewer a frame to interpret everything else. It is context that the data alone cannot provide.
A reference band (a lightly shaded horizontal strip) is useful for a range: “acceptable zone”, “confidence interval”, “prior-year range”. Keep the fill very light (opacity around 0.10 to 0.15) so it does not compete with the data.
Label the reference line directly on the chart: “Target: 95 %” at the right end of the line. Do not put it in the legend.
Before and after: one diagram
The diagram below shows two versions of the same three-series line chart. The left panel treats all three series equally — same weight, same color. The right panel applies focus: two series are muted to gray, one is accented, and a short annotation marks the key point.
The right panel contains exactly the same data. The difference is entirely in what is emphasized and what is quieted.
Runnable example
The code below builds a three-series line chart, grays out two series, accents the third, and places a direct annotation at its peak. Run it and observe which line your eye goes to first.
import matplotlib.pyplot as plt
import numpy as np

x = np.arange(2018, 2025)

# Three series — same domain, different trajectories
revenue   = np.array([1.1, 1.4, 1.9, 2.8, 3.6, 3.1, 3.9])
costs     = np.array([0.9, 1.1, 1.5, 2.0, 2.3, 2.1, 2.2])
headcount = np.array([0.5, 0.7, 1.0, 1.6, 2.0, 1.8, 2.1])

fig, ax = plt.subplots(figsize=(8, 5))

# Muted background series — gray, thinner, no legend entry needed
ax.plot(x, costs,     color="#aaaaaa", linewidth=1.5, zorder=1, label="Costs")
ax.plot(x, headcount, color="#aaaaaa", linewidth=1.5, zorder=1, label="Headcount index")

# Accent series — the story we are telling
ax.plot(x, revenue, color="#2563eb", linewidth=2.8, zorder=2)

# Direct annotation at the series end
ax.annotate(
    "Revenue",
    xy=(x[-1], revenue[-1]),
    xytext=(8, 0),
    textcoords="offset points",
    va="center",
    color="#2563eb",
    fontweight="bold",
    fontsize=10,
)

# Mark the peak year (argmax → 2024)
peak_idx = np.argmax(revenue)
ax.annotate(
    f"Strong year: {revenue[peak_idx]:.1f}x",
    xy=(x[peak_idx], revenue[peak_idx]),
    xytext=(0, 14),
    textcoords="offset points",
    ha="center",
    color="#2563eb",
    fontsize=9,
    arrowprops=dict(arrowstyle="-", color="#2563eb", lw=1),
)
ax.scatter([x[peak_idx]], [revenue[peak_idx]], color="#2563eb", zorder=3, s=50)

# Reference line for context — baseline year
ax.axhline(revenue[0], color="#cccccc", linewidth=0.8, linestyle="--")
ax.text(x[0] - 0.05, revenue[0] + 0.05, "2018 baseline",
        color="#999999", fontsize=8, ha="right")

# Minimal axis styling — drop heavy grid and box
ax.spines["top"].set_visible(False)
ax.spines["right"].set_visible(False)
ax.spines["left"].set_color("#dddddd")
ax.spines["bottom"].set_color("#dddddd")
ax.yaxis.grid(True, color="#eeeeee", linewidth=0.6)
ax.set_axisbelow(True)

ax.set_title("Revenue outpaced cost growth every year", fontsize=12, fontweight="bold", loc="left")
ax.set_ylabel("Index (2018 = 1.0)", color="#666666", fontsize=9)
ax.set_xticks(x)
ax.tick_params(colors="#666666", labelsize=9)

plt.tight_layout()
plt.show()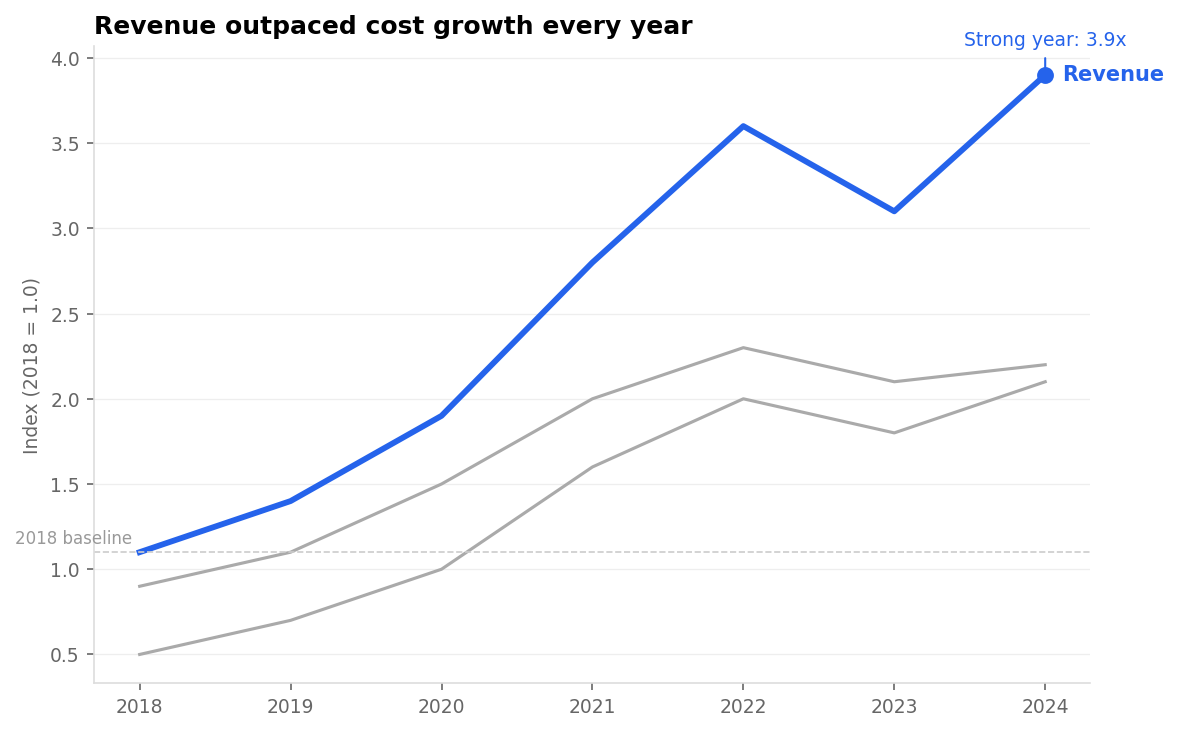
The eye lands on the blue Revenue line first — gray context, a directly-labelled accent series, the peak (3.9x, 2024) marked, no legend detour.
The eye goes to the blue line first, exactly as intended. Notice what the code does not do: there is no legend box floating in the corner, no colored background, no grid lines thicker than one pixel. The title restates the takeaway in plain English so the viewer who skips the axis labels still gets the message.
Putting it together: a checklist
When you finish a chart, run through these questions in order:
- What is the single thing I want the viewer to remember? Is it visually dominant?
- Is every other series or bar quieted enough that it does not compete?
- Have I labeled the key element directly, without requiring a legend lookup?
- Does the title state the insight, not just the variable names?
- Can I delete any grid line, border, or label without losing information?
If you answer yes to all five, the chart is ready.
In one breath
Vision has a fast mode that processes a few pre-attentive attributes — colour, size, position, enclosure, intensity — in under 250 ms, before conscious reading. Guiding the eye means exploiting it. Direct annotation beats a legend (label the line’s end, not a colour-key detour). Focus colouring — mute every other series to gray, give the one that matters the single accent colour — is the most reliable technique, because highlighting everything highlights nothing. Use reference lines/bands for context (a target, a baseline), labelled directly. And cut chartjunk — heavy gridlines, 3-D, redundant labels — to raise Tufte’s data-ink ratio: delete anything that doesn’t make the chart lie or become unreadable when removed. One accent, one annotation per chart; the scarcity is what gives it power.
Practice
Quick check
A question to carry forward
Every technique in this lesson leaned on the same lever: one accent colour against gray. We reached for blue, or red, almost reflexively. But colour is the most abused channel in all of data viz — and the choices hiding inside “just use a colour” are real. Which colour? Will the 1-in-12 men with red-green colour blindness still see your accent? When you’re encoding a quantity with colour — a heatmap, a choropleth — does equal numeric distance look like equal colour distance, or does the palette quietly lie?
So the final question of this section is: how do you use colour correctly — for clarity and for everyone? The last visualization lesson, colour and accessibility for clarity, covers sequential vs diverging vs categorical palettes, why perceptually-uniform colormaps like viridis beat the rainbow, and how to check a figure survives colour-blind vision and a grayscale printout.
Practice this in an interview
All questionsA data story has three components: a clear narrative arc (situation, complication, resolution), charts that each advance one argument rather than display all available data, and deliberate attention direction through annotation, color emphasis, and sequencing. The goal is that a viewer reading only the titles and callouts should understand the conclusion without reading every axis.
Coined by Edward Tufte, the data-ink ratio is the proportion of ink (or pixels) in a chart that encodes actual data, divided by the total ink used. Maximizing it means removing every element — gridlines, borders, tick marks, legends, decorative shading — that does not carry information the viewer cannot infer from the remaining ink.
An effective dashboard places the most critical metric in the top-left, groups related charts into logical sections, uses consistent scales and color across panels, limits the view to 5–9 metrics per screen, and is designed around a single primary question rather than trying to surface everything at once.
Charts mislead when visual area or slope no longer encodes the underlying ratio faithfully. The three most common traps are a truncated y-axis that magnifies trivial differences, dual axes that let the designer set any ratio between scales, and 3D perspective that foreshortens far elements and inflates near ones.