Choosing the right chart
Start from the question you are trying to answer, not the chart type — a practical decision guide for comparison, trend, distribution, relationship, and composition.
What you'll learn
- How to map your analytical question to the correct chart type
- Why pie charts mislead and when stacked bars beat them
- The data-type lens: categorical, continuous, and temporal variables
Before you start
Two chapters of matplotlib and seaborn gave you the power to make any chart. This one — the start of the storytelling chapter — is about making the right one. Because every chart type exists to encode a specific relationship between variables in a visual form that the human eye can decode quickly and accurately. The mistake most people make is starting with a chart they like and fitting data into it. The better move: start with the question, then pick the encoding that answers it most directly.
Start with the question, not the chart
There are five core analytical questions. Each maps cleanly to a family of chart types.
- Comparison — How does one category’s value compare to another’s?
- Trend — How does a value change over time?
- Distribution — How are values spread across a range?
- Relationship — Do two (or more) variables move together?
- Composition — What share of a whole does each part contribute?
The diagram below is your decision guide. Read the left column as the question in your head; follow the arrow to the chart family on the right.
Decision guide: map your question to a chart family, then apply the data-type lens.
The five chart families in detail
Comparison — bar chart
A bar chart encodes magnitude as length. Length is one of the most accurately perceived visual properties humans have — far more accurate than angle or area. When you want a reader to answer “which is bigger?” or “by how much?”, length wins.
- Sort bars by value (not alphabetically) unless there is a meaningful ordinal sequence.
- Use horizontal bars when category labels are long so they stay readable.
- Keep the y-axis starting at zero. Cutting the axis makes the differences look proportionally larger than they are — a genuine misrepresentation.
Trend — line chart
A line chart encodes change over time using slope and position. The connecting line is a promise: “there is continuity between these points.” That promise is appropriate when the x-axis is temporal (a date or time) or a genuinely continuous variable. If you connect bars representing discrete categories with a line, you imply an ordering and continuity that does not exist.
Distribution — histogram, box plot, violin plot
A histogram bins a continuous variable and shows how many values fall in each bin. It answers “where are most values clustered?” and “are there outliers or multiple peaks?”
A box plot summarises a distribution with five numbers: minimum, first quartile, median, third quartile, maximum. It is compact and great for comparing distributions across several categories side by side.
A violin plot is a box plot with a kernel density estimate overlaid — it shows the full shape of the distribution, not just five summary statistics.
Use a histogram when you have one continuous variable and want to show shape. Use box or violin when comparing distributions across groups.
Relationship — scatter plot
A scatter plot places one variable on each axis and draws a dot for each observation. The resulting cloud shows correlation (do the dots slope upward?), clustering (do points group together?), and outliers (which points are far from the mass?).
Add a regression line if you want to make a trend claim explicit — but remember: the scatter cloud carries the honest story, the line is a summary.
Composition — stacked bar (and why pie charts are usually worse)
A stacked bar chart encodes part-to-whole relationships as segments of a bar. The baseline for each segment is its left (or bottom) edge, and length differences between segments are readable because they share a common baseline.
A pie chart encodes composition as angle and arc. The human visual system judges angles and areas much less accurately than lengths with a shared baseline. Experiments consistently show that viewers struggle to tell whether a 34% slice is larger than a 38% slice when they are not adjacent. With more than two or three slices the errors compound further.
When a pie is acceptable: exactly two or three slices where one is a clear majority (for example, 75% vs 25%). For everything else, use a stacked bar — or better yet, a simple bar chart that lets each value stand on its own baseline.
The data-type lens
Before you commit to a chart, classify your variables:
- Categorical — named groups with no natural order (product names, countries, colours). These map to the x-axis of a bar chart or the grouping dimension of a scatter.
- Continuous — measured numbers that can take any value in a range (revenue, temperature, height). These drive histograms, scatter axes, and the y-axis of line charts.
- Temporal — dates and times. A special ordered type that implies continuity and should use a continuous time axis in a line chart — not discrete bars at monthly intervals unless you are making a deliberate aggregation point.
Mismatching axis type to variable type is a subtle but serious error. Plotting monthly revenue as a bar chart is fine; treating discrete survey responses as a continuous line is not.
Bad chart vs right chart — runnable demo
The same five data points, two encodings: a pie chart that forces you to compare angles, and a bar chart that uses length. See which one makes the ranking obvious.
import matplotlib.pyplot as plt
import numpy as np

labels = ["North", "South", "East", "West", "Central"]
values = [31, 28, 17, 14, 10]
colors = ["#6366f1", "#8b5cf6", "#a78bfa", "#c4b5fd", "#ddd6fe"]

fig, axes = plt.subplots(1, 2, figsize=(10, 4))
fig.suptitle("Same data — two encodings", fontsize=13, fontweight="bold", y=1.02)

axes[0].pie(values, labels=labels, colors=colors, autopct="%1.0f%%",
            startangle=90, wedgeprops=dict(linewidth=0.5, edgecolor="white"))
axes[0].set_title("Pie chart\n(compare the angles...)", fontsize=11)

sorted_idx = np.argsort(values)[::-1]
sorted_labels = [labels[i] for i in sorted_idx]
sorted_values = [values[i] for i in sorted_idx]
bars = axes[1].barh(sorted_labels, sorted_values,
                    color=[colors[i] for i in sorted_idx], height=0.6)
axes[1].set_xlim(0, 40)
axes[1].set_xlabel("Share (%)")
axes[1].set_title("Bar chart\n(rank is immediate)", fontsize=11)
for bar, val in zip(bars, sorted_values):
    axes[1].text(val + 0.5, bar.get_y() + bar.get_height() / 2,
                 f"{val}%", va="center", fontsize=10)
axes[1].spines[["top", "right"]].set_visible(False)

plt.tight_layout()
plt.show()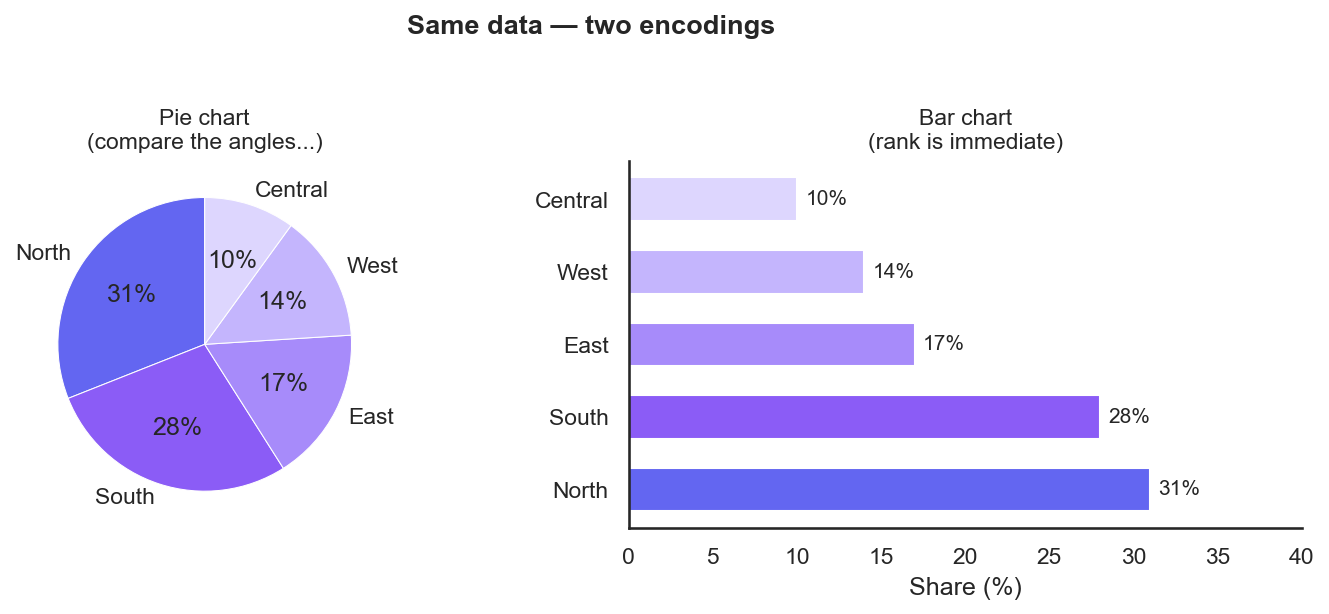
Same five numbers. The pie makes you compare angles (is North really bigger than South?); the sorted bar answers it instantly.
Compact decision guide
| Your question | Data types | Chart |
|---|---|---|
| How do categories compare? | Categorical + numeric | Bar chart |
| How does something change over time? | Temporal + numeric | Line chart |
| How are values spread? | One continuous | Histogram / box / violin |
| Do two variables correlate? | Two continuous | Scatter plot |
| What share makes up the whole? | Categorical + part values | Stacked bar (not pie) |
When no single type fits perfectly, ask which relationship matters most to your audience and encode that relationship first. A secondary relationship can live in colour, size, or a small multiples layout.
In one breath
Start from the question, not the chart gallery. Five analytical questions each map to a family: comparison → bar (length is the most accurately perceived encoding — sort it, start at zero); trend → line (the connecting line promises continuity, so use it only on a temporal/continuous axis); distribution → histogram for one variable, box/violin to compare across groups; relationship → scatter (the cloud carries the honest story); composition → stacked bar, not pie (angles and areas are judged far worse than lengths on a shared baseline). Then apply the data-type lens — categorical, continuous, temporal — and match the axis to the variable. The two classic lies to avoid: a truncated y-axis that inflates small differences, and a pie with more than two or three slices.
Practice
Quick check
A question to carry forward
You can now pick the chart that answers your question. But picking the right chart isn’t the same as making it land. The pie-vs-bar demo hinted at it: even the correct bar chart, dropped raw onto a slide, just sits there as five numbers. A reader still has to work out what it means and what they should do.
So the question to carry forward is: once the chart is the right one, how do you shape it into a story — an opening that frames the stakes, a single clear takeaway, the eye guided to the one bar that matters? The next lesson, the narrative arc of a chart, turns a correct plot into a persuasive one: setup, tension, resolution, applied to a single figure so your audience leaves knowing not just what the data says, but what to do about it.
Practice this in an interview
All questionsMatch the chart to the relationship in the data: comparison across categories calls for bars, trends over continuous time call for lines, correlation between two numeric variables calls for a scatter plot, and distribution shape calls for a histogram or box plot. The question you are answering — not aesthetics — drives the choice.
Charts mislead when visual area or slope no longer encodes the underlying ratio faithfully. The three most common traps are a truncated y-axis that magnifies trivial differences, dual axes that let the designer set any ratio between scales, and 3D perspective that foreshortens far elements and inflates near ones.
Pie charts work only when you have two to three parts whose proportions differ substantially and sum to a meaningful whole. Beyond that, humans compare angles and arc lengths poorly, making slices of similar size indistinguishable. A sorted bar chart almost always communicates the same information more accurately.
A data story has three components: a clear narrative arc (situation, complication, resolution), charts that each advance one argument rather than display all available data, and deliberate attention direction through annotation, color emphasis, and sequencing. The goal is that a viewer reading only the titles and callouts should understand the conclusion without reading every axis.