MLflow — experiment tracking that doesn't lie to you
Stop guessing which notebook produced the model in prod. MLflow is the duct tape between 'I trained a model' and 'I can reproduce, compare, and roll back any model I've ever trained.'
Written and reviewed by Shreyash Prashu Last reviewed
What you'll learn
- The four primitives — params, metrics, artifacts, runs — and why they're enough
-
start_runas a context manager and what to put inside it - Auto-logging for sklearn — the one-line setup that's almost always enough
- The Model Registry — Staging vs Production vs Archived, and what those actually mean
Before you start
The last chapter ended on a reproducibility question: a data contract proves what data flowed in, but when a model misbehaves you also need to answer which model — trained on which snapshot, by which commit, with which hyperparameters, scoring what against the baseline. We said that provenance evaporates within a week unless something records it. This lesson is that something.
You’ve trained 40 models this quarter. Three of them are in production somewhere. One of them was that 0.91 F1 you mentioned in a Slack message two months ago, and you have absolutely no idea which Python script generated it or what hyperparameters it used.
This is the problem MLflow exists to solve, and you can adopt the 80% useful subset in about ten minutes of work.
The four primitives
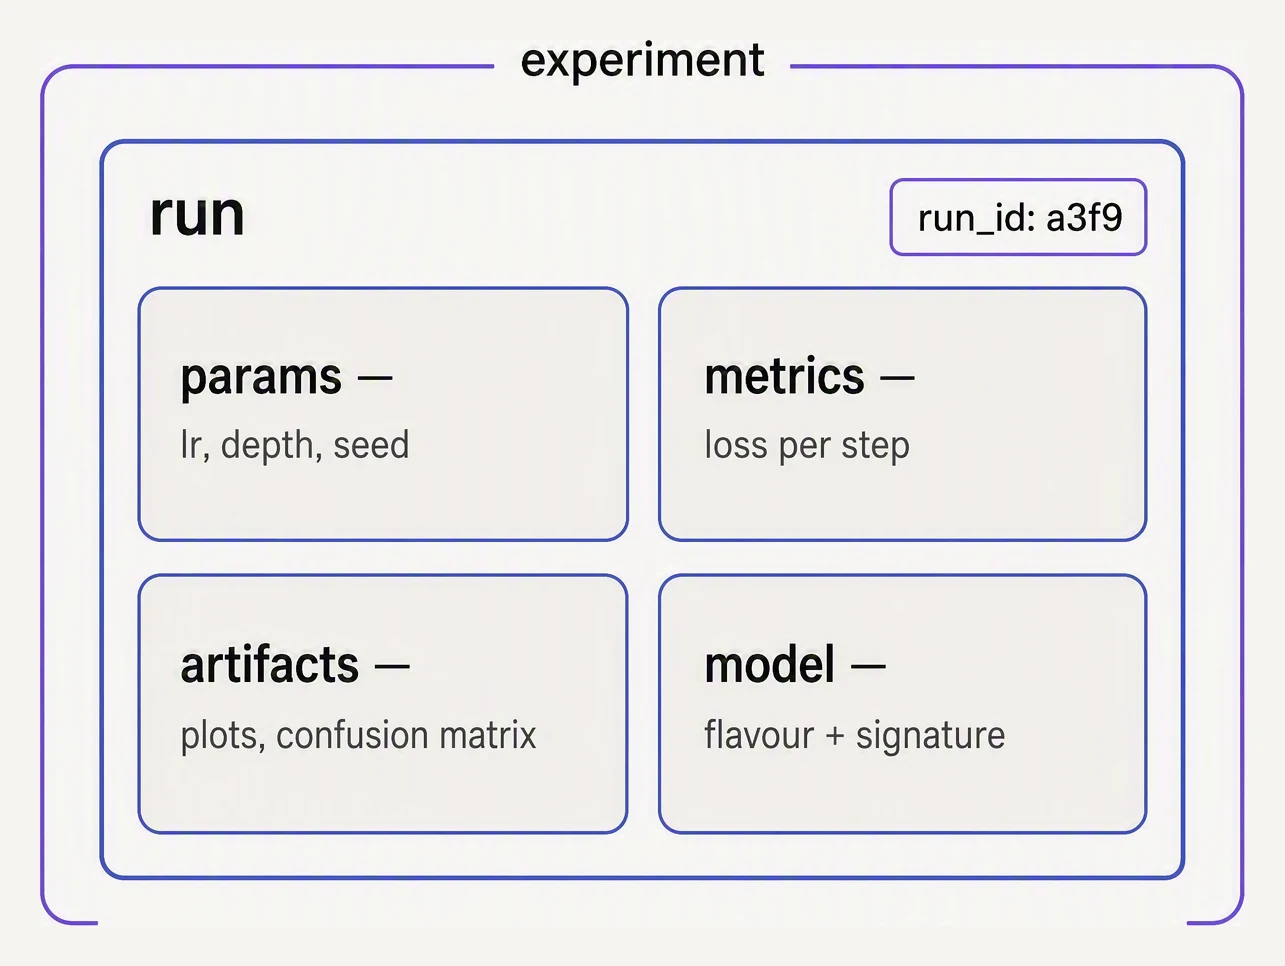
A run is one attempt, recorded completely enough to reproduce.
MLflow Tracking has exactly four things you need to know:
| Primitive | What it is | What you put there |
|---|---|---|
| Run | A single training execution | Wrapped with with mlflow.start_run(): |
| Params | Inputs that defined the run | learning_rate, n_estimators, dataset hash |
| Metrics | Outputs that measured the run | f1, auc, val_loss over epochs |
| Artifacts | Files produced by the run | The model itself, plots, feature importance, the eval report |
Plus one organizational layer above runs:
- Experiment — a named grouping of runs. One experiment per problem (“customer-churn-v2”, “spam-classifier-prod”).
That’s the whole vocabulary. Internalize it and the rest is API surface.
A wrapped training run
The pattern: open a run, log params, train, log metrics, log the model as an artifact, exit the context.
import os, tempfile, joblib
import mlflow

from sklearn.datasets import make_classification
from sklearn.ensemble import RandomForestClassifier
from sklearn.model_selection import train_test_split
from sklearn.metrics import f1_score, accuracy_score

# Use a local filesystem tracking URI for this demo.
mlflow.set_tracking_uri("file://" + tempfile.mkdtemp())
mlflow.set_experiment("churn-demo")

X, y = make_classification(n_samples=2000, n_features=8, weights=[0.8, 0.2], random_state=0)
X_tr, X_te, y_tr, y_te = train_test_split(X, y, stratify=y, random_state=0)
params = {"n_estimators": 200, "max_depth": 6, "class_weight": "balanced"}

with mlflow.start_run(run_name="rf_baseline") as run:
    mlflow.log_params(params)                                   # 1) inputs that define the run
    model = RandomForestClassifier(random_state=0, **params).fit(X_tr, y_tr)   # 2) train
    pred = model.predict(X_te)
    mlflow.log_metric("f1",       f1_score(y_te, pred))         # 3) outputs that measure the run
    mlflow.log_metric("accuracy", accuracy_score(y_te, pred))
    with tempfile.TemporaryDirectory() as tmp:                  # 4) the model artifact itself
        path = os.path.join(tmp, "model.joblib")
        joblib.dump(model, path)
        mlflow.log_artifact(path, artifact_path="model")

    print("run id:", run.info.run_id)
    print("logged:", params)
    print(f"f1={f1_score(y_te, pred):.3f}  acc={accuracy_score(y_te, pred):.3f}")
run id: 3a7f… (a fresh 32-char hex id on every run)
logged: {'n_estimators': 200, 'max_depth': 6, 'class_weight': 'balanced'}
f1=0.969 acc=0.988When that runs, MLflow has a complete record: the params you tried (logged: {...}), the metrics you got
(f1=0.969, acc=0.988), and the model file itself — all stamped with a run id that ties them together. That run id
is a fresh hex string each time, which is exactly the point: every execution becomes a permanent, addressable
record instead of a notebook you’ll never find again. Re-open the tracking UI later (mlflow ui) and you can see
every run side by side, sortable by metric, filterable by param.
Auto-logging — the one-line shortcut
For sklearn (and xgboost, lightgbm, pytorch, tensorflow, statsmodels…), you don’t have to log params manually. Turn on auto-logging and MLflow introspects the estimator’s hyperparameters and logs them all.
import mlflow

mlflow.sklearn.autolog()    # turn this on once at the top of your script

# Now everything below logs automatically:
with mlflow.start_run():
    model = RandomForestClassifier(n_estimators=200).fit(X_tr, y_tr)
    # params, training metrics, the model itself — all logged.
Auto-logging is the right default for 95% of work. Reach for explicit
log_param / log_metric when you have custom things to track —
business metrics, dataset hashes, evaluation on slices — that the library
doesn’t know about.
The UI — comparing runs
The MLflow UI (mlflow ui from the directory where you ran tracking)
gives you a sortable table of every run with params as columns and
metrics as columns. The two workflows that earn their keep:
- Sort by metric, descending. Find your best run instantly. Click in to see all params and artifacts. Reproduce by re-running with those params.
- Multi-select two runs → “Compare”. Side-by-side diff of params, metric curves over epochs, and artifacts. This is how you actually do “what changed between run 17 and run 23?” without scrolling through notebooks.
In team settings, point MLflow at a shared backend (Postgres + S3 / GCS) so everyone logs to the same place. Now “the team’s best model” is a sortable query, not a tribal memory.
Which hyperparameters led to the best metric?
Each row is one MLflow run. Check runs to add their polyline to the parallel-coordinates plot. Sort by any column. The best AUC run is highlighted — each axis represents one dimension normalised 0–1, so higher is always better (LogLoss is flipped).
| Run | LR | Depth | Trees | AUC ↑ | LogLoss ↓ | |
|---|---|---|---|---|---|---|
| run_03best | 0.10 | 6 | 200 | 0.912 | 0.298 | |
| run_04 | 0.20 | 8 | 300 | 0.897 | 0.323 | |
| run_02 | 0.05 | 4 | 150 | 0.874 | 0.361 | |
| run_05 | 0.30 | 10 | 400 | 0.856 | 0.378 | |
| run_01 | 0.01 | 3 | 100 | 0.831 | 0.412 | |
| run_06 | 0.50 | 12 | 500 | 0.803 | 0.451 |
The Model Registry — the promotion ladder
Once you have a good run, promoting it to a production-blessed artifact is its own step. That’s the Model Registry.
A registered model has:
- A name (
churn-classifier). - Versions (1, 2, 3, …), each pointing to a specific run + artifact.
- Aliases (MLflow 2.x+) — human-readable pointers like
champion,challenger,staging. These replaced the older fixed stage strings.
The older four stages (None, Staging, Production, Archived) are
still widely used and still work, but MLflow 2.9+ recommends aliases
because they’re flexible (you can have champion, shadow, canary
all at once) and not constrained to a fixed vocabulary.
The pattern is: train → log run → register a new version → assign the
staging alias → run integration tests / shadow traffic → reassign the
champion alias to the new version.
The previous champion version doesn’t get deleted — archive it or just
leave the old version in place as your rollback target.
# Register a model from a run
result = mlflow.register_model(
    model_uri=f"runs:/{run_id}/model",
    name="churn-classifier",
)

# Promote a version (MLflow 2.x+: prefer aliases over stages)
from mlflow.tracking import MlflowClient
client = MlflowClient()
# Stage-based API (still works, soft-deprecated in MLflow 2.9+):
client.transition_model_version_stage(
    name="churn-classifier",
    version=result.version,
    stage="Staging",
)
# Alias-based API (preferred in MLflow >= 2.9):
client.set_registered_model_alias(
    name="churn-classifier",
    alias="staging",
    version=result.version,
)
Loading “whatever is in Production” by name is a one-liner, which means your serving code never embeds a specific model path:
# Stage-based (still works, soft-deprecated in MLflow >= 2.9):
model = mlflow.pyfunc.load_model("models:/churn-classifier/Production")
# Alias-based (preferred):
model = mlflow.pyfunc.load_model("models:/churn-classifier@champion")
When you promote a new version or update an alias, the URI resolves to the new artifact on next load. Rollback is one API call. That single property — model loading by name rather than path — is what makes the registry worth the setup cost.
What to log in every single run
A useful default list, that you’ll thank yourself for in six months:
- All hyperparameters (auto-logging gets these).
- Dataset identifier — file hash, or
(table, snapshot_date, row_count). - Git commit hash of the training code.
- Library versions — at minimum sklearn / xgboost / pytorch / Python.
- The metric you care about, plus precision/recall/F1 if classification.
- Per-slice metrics if your eval set has slices.
- The model artifact, plus a
requirements.txt/conda.yamlso loading code can recreate the env.
You can wrap this in a log_standard_metadata(run) helper and call it from
every training script. That helper is your team’s actual MLOps maturity —
not the choice of mlflow vs wandb vs neptune.
In one breath
MLflow turns every training run into a permanent, addressable record built from four primitives — a run wrapping
params (the inputs that defined it), metrics (the outputs that measured it), and artifacts (the model and
files it produced) — with sklearn.autolog() capturing most of it in one line; the registry then promotes a
chosen run to a named, versioned model loaded by alias (models:/churn-classifier@champion) rather than path,
which is what makes promotion and one-call rollback possible without touching serving code.
Practice
Before the quiz, reason about the dataset hash. Auto-logging captured every hyperparameter automatically — yet the
lesson insists you manually log a hash of the training data on top. Given that the run already records params,
metrics, and the model, what exactly can you not reconstruct three months later without that one extra line? And
the registry side: why does loading models:/churn-classifier@champion instead of a hard-coded artifact path turn
a 3 a.m. rollback into a single API call?
Quick check
models:/churn-classifier@champion instead of a specific artifact path?mlflow.log_metric and mlflow.log_param manually?A question to carry forward
We just made a big deal of logging the dataset hash in every run — and it is the right instinct. But look
closely at what a hash actually is: a fingerprint, not the thing itself. MLflow faithfully records that your model
trained on data with hash a3f9…, and three months later that string tells you, with certainty, that the data
has changed — and absolutely nothing about how to get the original bytes back.
So the question to carry forward is the gap that hash exposes. Tracking records which data you used; it does not store it, and a 5 GB training file plainly cannot live in your git repo next to the code. How do you version a dataset the way you version code — so that checking out an old run restores not just the script but the exact data it learned from? That is data and model versioning, and the next lesson builds it with DVC.
Practice this in an interview
All questionsExperiment tracking captures the full reproducibility context of a training run — code version, hyperparameters, dataset hash, environment, and metrics — so any result can be reproduced and compared. MLflow is an open-source, self-hosted lifecycle platform; Weights and Biases is a hosted, collaboration-first product with richer real-time visualisation.
Apply FinOps to ML by tagging every workload (training jobs, endpoints, GPU pools) by team, model, and environment so cost is attributable, then track unit-economics metrics like cost per prediction or per training run rather than just total spend. Set budgets and alerts, identify idle GPUs and overprovisioned endpoints, and enforce guardrails like autoscaling and instance-type policies. The goal is continuous visibility and accountability so teams optimize cost without killing experimentation.
Full ML reproducibility requires locking three layers: the random seed across all frameworks, the software environment via pinned dependency manifests or container images, and the training data via content-addressed versioning. Missing any one layer means the same code can produce different models on different runs or machines.
The ML lifecycle spans eight phases: problem framing, data collection and validation, feature engineering, training and experimentation, offline evaluation, deployment, production monitoring, and retirement or retraining. Each phase has distinct owners, artefacts, and failure modes that an MLOps practice must systematise.