A/B testing & experimentation
Deploying a model gets it live; A/B testing proves it's actually better. Hypothesis testing, primary vs guardrail metrics, sample size, and variance reduction with CUPED.
What you'll learn
- Why online A/B testing is the real measure of a model improvement
- Primary metrics vs guardrail metrics, and sample-size/power
- Reducing variance with CUPED to reach significance faster
Before you start
The last lesson drew a sharp line and then left us standing on it: a canary gets v2 running safely, but “running” is not “better.” A canary will happily ramp a v2 that is stable, fast, error-free — and very slightly worse for users than v1 — because its job is safety, not improvement. We asked how to prove v2 genuinely wins, with statistics rather than hope. This lesson is the proof.
Deployment strategies like canary and shadow get a new model running in production. But “running” isn’t “better.” A model with higher offline accuracy can lose in production — slower responses, weird edge cases, a metric that didn’t translate to user behavior. A/B testing is how you actually prove the new model wins, with statistics instead of hope.
The setup: split traffic, compare
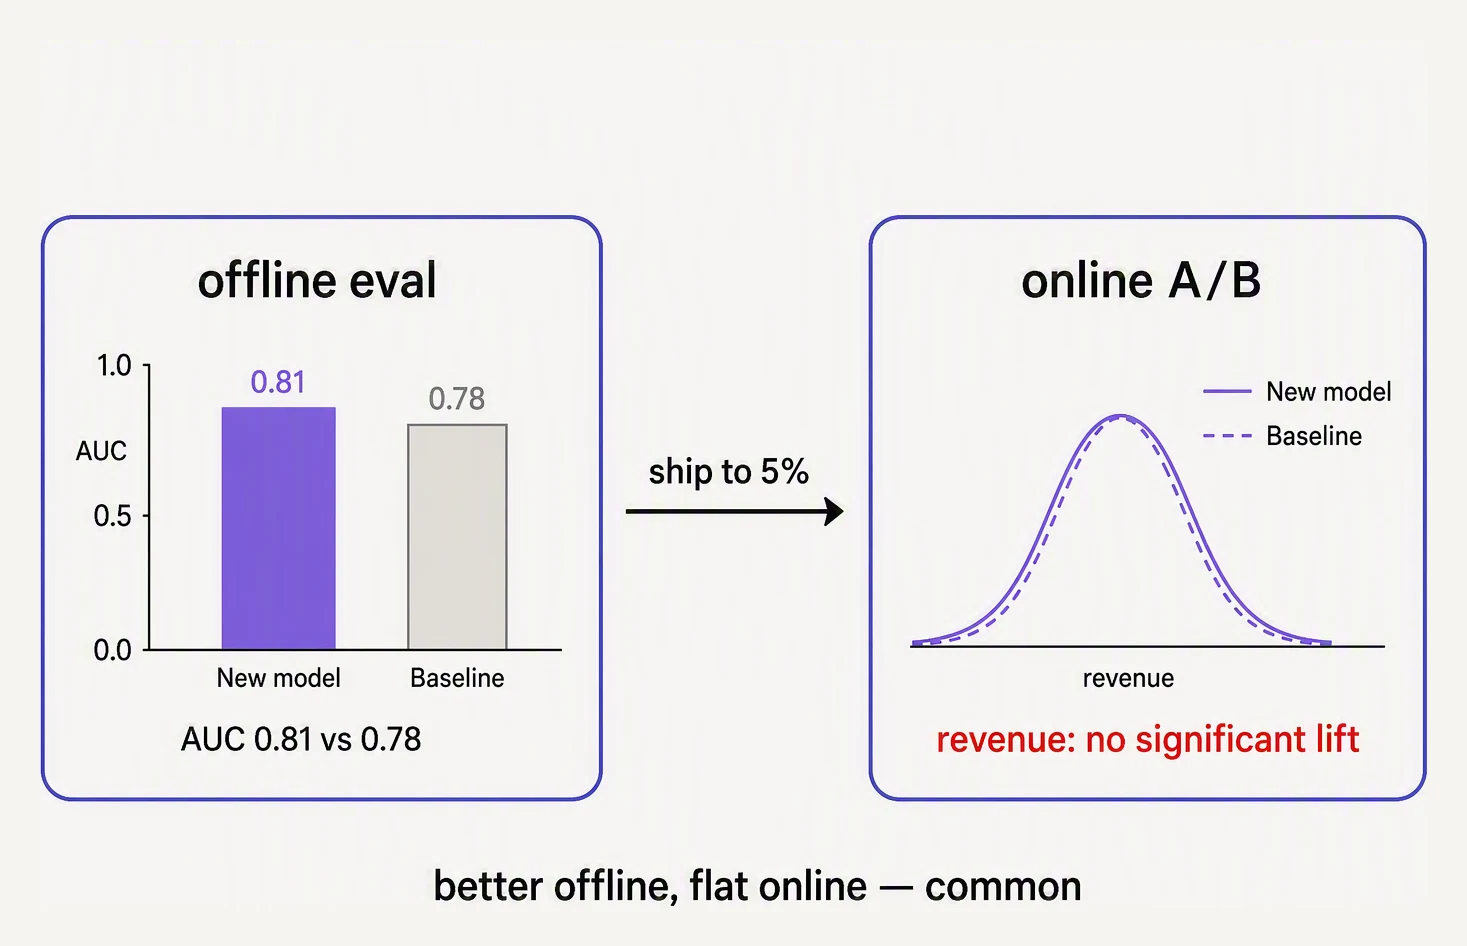
Offline is a filter, not a verdict. Only the online test decides.
Randomly split users into control (old model A) and treatment (new model B), serve each its model, and compare a metric. The question is never “is B’s number higher?” — random noise guarantees some difference — but “is B’s number higher beyond what noise would produce?” That’s a hypothesis test: you reject the null (“no difference”) only when the gap is statistically significant.
The trap is sample size. A true 8% lift is invisible until you’ve collected enough data for it to clear the noise band. Watch the confidence interval tighten:
A real effect is invisible until you have the samples
Variant B truly converts 8% better. But you only detect it once the confidence interval clears zero. Grow the traffic and days — and try CUPED to tighten the interval with the same data.
Primary metrics vs guardrail metrics
Optimizing one metric blindly is how you ship a disaster. So every experiment has two kinds:
- Primary metric — the thing you’re trying to improve (conversion, click-through, revenue per session).
- Guardrail metrics — things that must not get worse, even if the primary improves: latency, error rate, unsubscribes, infra cost. A new model that lifts conversion 2% but doubles p99 latency is not a winner.
A result ships only if the primary metric wins and no guardrail breaks.
CUPED — get to significance faster
You don’t always have the traffic to wait. CUPED (Controlled-experiment Using Pre-Experiment Data) reduces variance by adjusting each user’s metric using a pre-experiment covariate — typically their own behavior before the test. Because a heavy user was always going to convert more, removing that predictable component shrinks the noise, often cutting the needed sample size by ~50% for the same power. Toggle it in the widget and watch the interval tighten.
import numpy as np

from scipy import stats

rng = np.random.default_rng(0)
n = 4000
# Control vs treatment conversions; B has a small TRUE lift (0.100 -> 0.108).
control   = rng.random(n) < 0.10
treatment = rng.random(n) < 0.108

diff = treatment.mean() - control.mean()
# Two-proportion z-test
p_pool = np.concatenate([control, treatment]).mean()
se = np.sqrt(p_pool * (1 - p_pool) * (2 / n))
z = diff / se
pval = 2 * (1 - stats.norm.cdf(abs(z)))

print(f"observed lift: {diff*100:+.2f} pp")
print(f"z = {z:.2f},  p = {pval:.3f},  significant = {pval < 0.05}")
observed lift: +0.83 pp
z = 1.19, p = 0.234, significant = FalseRead that result slowly, because it is the whole lesson in three numbers.
We built in a real lift — treatment converts at 0.108 versus control’s 0.100 — and the experiment even
measured it correctly: the observed lift is +0.83 percentage points, almost exactly the truth. And yet
significant = False, with p = 0.234, nowhere near the 0.05 line.
The effect is real and we still can’t claim it, because 4,000 users per arm simply isn’t enough data
for an 8%-relative lift to climb out of the noise. This is the underpowered trap, and it is the most expensive
mistake in experimentation: shipping “no significant difference” as “no difference,” and killing a genuinely
better model for lack of sample size. Push n to 40,000 and this exact lift becomes unmistakable — same effect,
more evidence.
In one breath
A/B testing is how you prove a new model actually wins instead of merely running: randomly split users into control (A) and treatment (B).
Ask not “is B’s number higher?” — noise guarantees some gap — but “is it higher beyond what noise produces?” That is a hypothesis test you can only pass with enough sample. A real +0.8pp lift was invisible at n=4,000, p=0.234, and unmistakable at n=40,000.
Every experiment guards a primary metric with guardrail metrics that must not regress. It avoids the peeking trap by fixing sample size in advance, and can reach significance on ~half the traffic with CUPED variance reduction.
Practice
Before the quiz, sit with the underpowered result. The experiment measured the lift almost perfectly (+0.83pp vs a true 0.8pp) yet reported “not significant.” In your own words, what would be the wrong decision to make from that output, and what is the one thing you’d change to detect the real effect?
Then the guardrail question: a model lifts conversion 2% but doubles p99 latency — walk through why “primary metric won” is not enough to ship it, and what the guardrail is protecting.
Quick check
A question to carry forward
The A/B test is a verdict, not an explanation. Run one and you might get the dreaded result this whole chapter has kept hinting at: a model that won every offline metric loses online — fewer conversions, worse engagement, a guardrail creeping the wrong way.
The test tells you, unarguably, that v2 is worse for real users. It does not tell you why.
And the single most common why — the one behind that recommender whose CTR dropped 30% in the canary — is quietly disturbing: the model is being fed different numbers in production than it saw in training. A feature computed one way in the training pipeline and another way at serving time means your live model is, in effect, a different model than the one you evaluated. No amount of A/B rigor will fix a model that’s eating corrupted inputs.
So the question to carry forward is: when an offline-great model fails the online test, how do you detect and diagnose the gap between training-time and serving-time features that is so often the culprit? That is training-serving skew, and it is the next lesson.
Practice this in an interview
All questionsOffline metrics often don't predict business impact, so you run a controlled online experiment: split live traffic between the current champion and the new challenger and compare a pre-registered business metric with a statistical significance test. You size the test for adequate power, watch guardrail metrics like latency and errors, and only ship if the lift is statistically and practically significant. Variance-reduction techniques like CUPED let you reach significance faster.
A fixed A/B test holds traffic splits constant to get a clean, statistically powered comparison, which is ideal when you need a trustworthy ship decision. A multi-armed bandit dynamically shifts traffic toward the better-performing model, reducing regret when you can't run long enough for significance or when the best arm may change. Shadow deployment sends real traffic to the new model without serving its outputs, so you validate behavior and latency risk-free before any user is exposed.
CUPED (Controlled-experiment Using Pre-Experiment Data) removes variance in the outcome metric that is explained by a pre-experiment covariate — typically the same metric measured before the experiment. This makes the residual variance smaller, which is equivalent to running a more powerful test or reaching significance faster with the same sample.
A rigorous A/B test starts with a pre-registered decision, hypothesis, primary metric, randomization unit, minimum detectable effect, significance level, power, and fixed runtime. Random assignment, validated instrumentation, and a fixed analysis plan then estimate whether the change creates a practically worthwhile effect rather than a post-hoc false positive.