Testing ML & the ML Test Score
Unit tests on code are not enough. Learn how to test ML data, model behavior, infrastructure, and monitoring, then use Google's ML Test Score to aggregate test maturity and a separate weakest-category view to expose blind spots before production does.
What you'll learn
- Why ML testing must cover data, model behavior, infrastructure, and monitoring
- How the ML Test Score aggregates the maturity of individual checks instead of using a weakest-category rule
- How to build data, slice, invariance, reproducibility, and serving-parity tests
- How to diagnose the first production symptom of common ML testing failures
Before you start
At 3:07 a.m., the lending model is still returning HTTP 200 responses. CPU is normal. The deployment is green. The model scored 0.91 F1 on its held-out test set.
Yet approval rates have fallen by 18%.
The upstream team changed income from dollars to cents. The feature still has
the same name, the same numeric type, and no nulls. Every unit test passes. The
model is now seeing values 100 times larger than it saw during training.
That is the peculiar shape of ML failure: the program can be correct while the thing it learned from, or the behavior it produces, is wrong. A passing test suite is evidence. It is not a blessing from the reliability gods.
Testing an ML system therefore means testing four different things: the data entering the system, the model’s behavior, the machinery around it, and the signals that tell you when reality has changed. Google’s ML Test Score is a useful map for doing that without treating one impressive accuracy number as a complete safety certificate.
Four kinds of tests
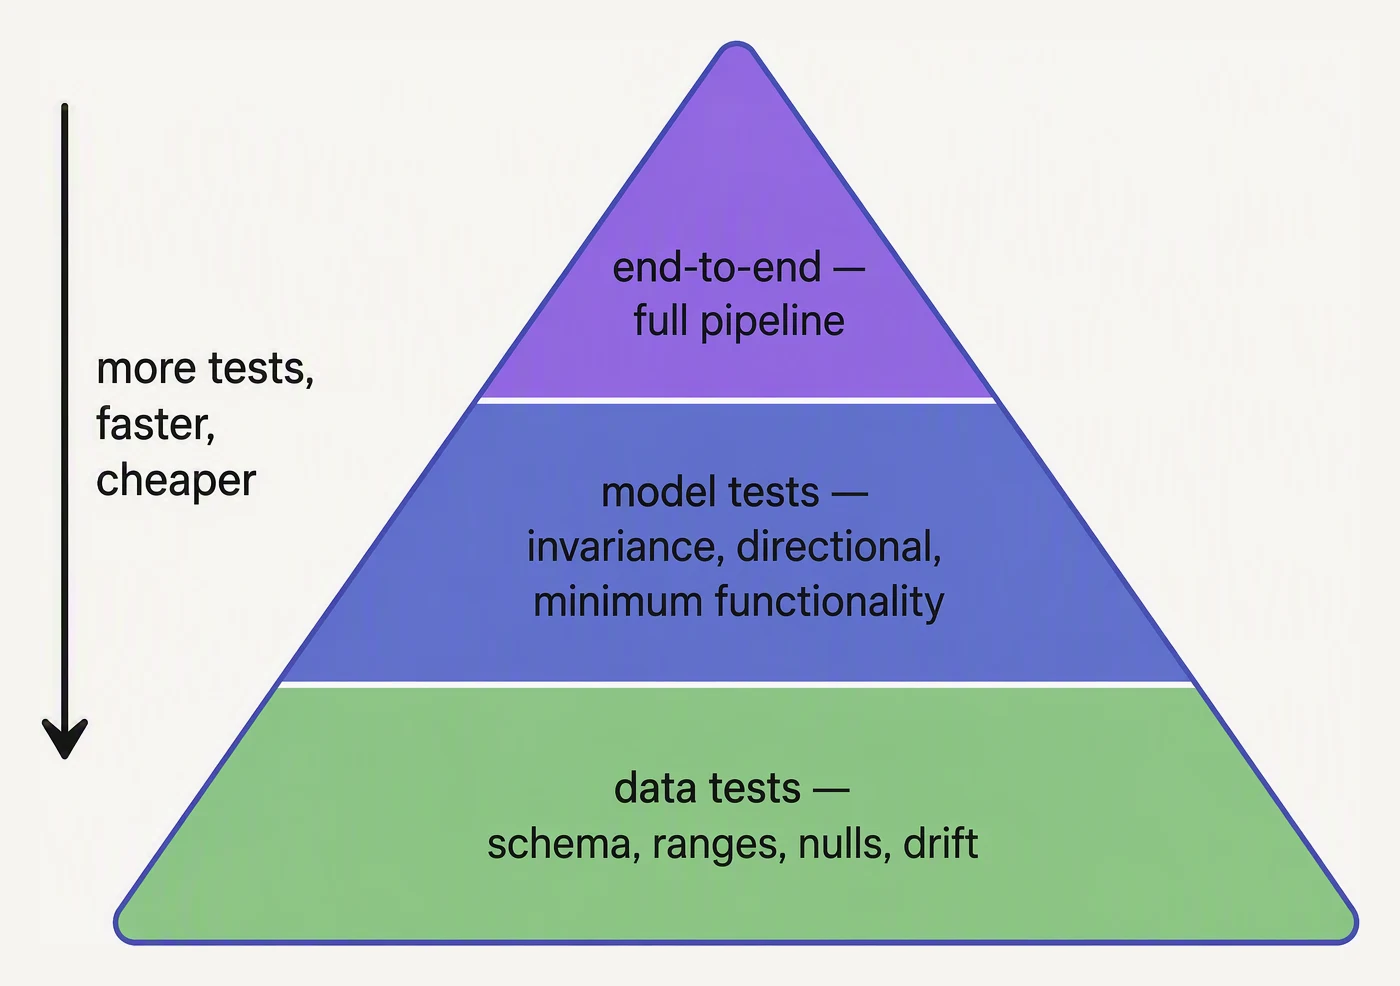
Many cheap tests sit close to the data; fewer expensive tests exercise the whole system.
The ML Test Score is Google’s rubric for production-readiness checks. Its original version contains 28 tests across four areas. Each check can be absent, manual, or automated; adapt the checklist to your system’s risks.
Data tests ask whether the model receives data it was built for. They check
schema, types, units, null rates, ranges, freshness, duplicates, leakage, and
distribution changes. A schema test can confirm that income is numeric; a
semantic test must also confirm that it is measured in dollars. Data tests cover
training-serving skew, too: training might use
30 days of transactions while serving uses 24 hours. Both values can look
plausible while describing different features.
Model tests ask whether the artifact behaves well enough to use. Check against a simple baseline, metric thresholds, important slices such as region or device, calibration, and invariance. Overall F1 can be 0.91 while F1 for rural applicants is 0.62 if that group is only 4% of evaluation data. An invariance test specifies a change that should not alter the result, such as adding a neutral word to a spam message.
Infrastructure tests check reproducible training, versioned data and dependencies, serialization, pipeline integration, health, load, rollback, and the serving boundary. Loading a Python module is not an integration test; it only proves that Python found the module.
Monitoring tests check whether production can reveal failures in the other three areas. Track errors, latency, volumes, score distributions, freshness, drift, and eventual quality when labels arrive. Test monitoring itself with a synthetic event: verify the metric, alert, notification, dashboard, and runbook. ML observability is a detection and response system, not just a collection of charts.
Production-ready is your weakest dimension
Google's ML Test Score rates readiness across four categories. Check the tests your pipeline actually has. The catch: your overall score is the minimum across categories — great models with no monitoring still score zero.
What Google’s score measures—and a separate weakest-category policy
The original ML Test Score scores individual checks by implementation maturity: absent earns 0, manual earns 0.5, and repeatably automated earns 1. The rubric then aggregates those points:
normalized score = sum of check points / maximum possible points
It is not the smallest category proportion.
Suppose the lending team has this illustrative inventory of 28 checks:
| Area | Check mix | Points earned | Maximum | Area proportion |
|---|---|---|---|---|
| Data | 5 automated, 2 manual, 1 absent | 6.0 | 8 | 0.75 |
| Model | 4 automated, 3 manual, 1 absent | 5.5 | 8 | 0.69 |
| Infrastructure | 4 automated, 2 manual | 5.0 | 6 | 0.83 |
| Monitoring | 1 automated, 2 manual, 3 absent | 2.0 | 6 | 0.33 |
| Total | 14 automated, 9 manual, 5 absent | 18.5 | 28 | 0.66 |
The normalized aggregate is about 0.66. Monitoring is the weak area at 0.33, but that is a category diagnostic, not Google’s overall score. Averaging the four proportions would also be a different calculation because categories contain different numbers of checks.
A team may add a local weakest-category gate: “do not deploy if any critical
area is below 0.50.” This is separate from the ML Test Score and can prevent one
unmonitored system from being averaged into safety. It has a cost: a small
category can dominate the decision, and an automated check can still be shallow.
Choose thresholds, weights, and critical checks deliberately, and label the
dashboard metric weakest critical category, not Google’s score.
The score is a prioritization tool, not a guarantee. A score of 1.0 does not prove correct labels, ethical policy, or resilience to a new economic regime. It shows how much engineering evidence exists and where that evidence is thin.
The mechanism: what each test can and cannot prove
Software tests compare known inputs with known outputs. ML tests need those checks, but also checks on populations and distributions.
The causal chain is:
- Training data determines what relationships the model can learn.
- Training turns that data into a model artifact.
- Feature transformations and serving code turn a live request into model input.
- The artifact produces a prediction.
- A changing world determines whether that prediction was useful.
A unit test may prove that a transformation returns a float. A data test can check whether the value is in range. A model test can check a fixed-set quality threshold. An infrastructure test can verify that the same artifact loads in production. Monitoring can detect when live inputs or outcomes no longer match the tested situation.
No layer proves the next one. An ML test suite is therefore a chain of evidence:
- Reject malformed or semantically impossible data before training.
- Reject models that fail the baseline, a critical slice, or a behavioral rule.
- Reject artifacts that cannot be reproduced, loaded, rolled back, or served.
- Deploy only with monitors and alerts that have been tested themselves.
This ordering also saves money: a five-second schema check should run before a two-hour training job.
A small data gate with real numbers
This inexpensive test can run in CI before training:
import pandas as pd, numpy as np

# A tiny "data test" you can run in CI before training.
df = pd.DataFrame({"age": [25, 34, -3, 41, 999], "income": [50000, 62000, 58000, np.nan, 71000]})

def validate(df):
    errs = []
    if (df["age"] < 0).any() or (df["age"] > 120).any(): errs.append("age out of range")
    if df["income"].isna().mean() > 0.1: errs.append("too many missing incomes")
    if df["age"].isna().any(): errs.append("null ages")
    return errs

problems = validate(df)
if problems:
    raise ValueError(f"data test failed: {problems}")

print("data test: PASS")
With this fixture, the script stops at raise:
ValueError: data test failed: ['age out of range', 'too many missing incomes']The uncaught exception gives CI a nonzero exit status, so training cannot quietly
continue. The age values -3 and 999 violate the range rule. One missing
income among five rows is a 20% null rate, above the 10% limit. The null-age
rule does not fire because every age is present.
This test does not prove that income is in dollars or that labels are correct. Those require a unit contract, distribution checks, and label-quality processes. Each test is powerful because its claim is defined; it becomes dangerous when treated as proof of everything. Version rules with the pipeline, and give thresholds an owner and a review path when the business changes.
Failures you notice first
The schema passes, but the meaning changed
A sudden shift in scores or business actions, with green schema dashboards, often means a semantic change such as dollars becoming cents. Test units, representative ranges, quantiles, and known input-output fixtures. Compare live batches with a reference window using tolerances: legitimate seasonal changes should not automatically block deployment.
The aggregate metric hides a broken group
A complaint from one region, device class, or customer group may arrive while the headline metric is stable because large groups dominate the average. Add slice metrics for product, risk, and regulatory groups, with minimum sample sizes. Choose the policy—minimum recall, error gap, calibrated probabilities, or review queue—before making the test a deploy gate.
Offline quality is high, then production quality collapses
A gap between evaluation and live quality often indicates leakage or a bad split. For a credit model, use time-based evaluation, build features only from information available at the decision timestamp, and deduplicate entities where needed. Keep the evaluation set untouched. A score earned using tomorrow’s information is not a real 0.91.
The artifact works in CI but not at the serving boundary
A changed prediction distribution, feature-order error, or production-only deserialization failure indicates a boundary problem. Serialize and load the artifact in a clean environment, send a fixed request through the actual serving path, and compare the feature vector and prediction with the training reference. Version the model, feature code, and environment together. Data and model versioning makes this lineage useful for debugging.
The monitor exists but never pages
An incident discovered by a customer usually means the metric is missing, the query excludes the serving job, the threshold is unreachable, or labels have not arrived. Test the full alert path and use proxies such as freshness, volume, score distribution, and drift while waiting for outcomes. Drift says inputs changed; it is a reason to investigate, not a quality metric.
Put the tests where they can stop damage
A maintainable CI and deployment layout is:
- Pull request: schema, unit, fixture, and transformation tests.
- Training job: data validation, leakage controls, baseline, aggregate, and slice metrics.
- Artifact build: record versions, load in a clean environment, and run an inference smoke test.
- Pre-production: real request path, load test, alert delivery, and rollback.
- Production: service health, data behavior, predictions, and delayed outcomes.
Not every check should block every change. An unstable tiny slice may warn for review; a missing feature or failed rollback test should block deployment. Ask what evidence a particular risk requires before it is acceptable.
There is a cost. Tests need owners, thresholds, representative fixtures, and maintenance. Overly strict tests slow delivery and invite workarounds; vague tests pass while the system rots. Start with invalid data, training-serving mismatch, critical slice regression, rollback, and silent monitoring.
In one breath
Testing ML means more than testing code because corrupt data, leaked or degraded models, serving mismatches, and undetected production changes can leave every unit test green. Google’s ML Test Score organizes evidence into data, model, infrastructure, and monitoring categories and aggregates individual-check maturity. A separate weakest-category policy can stop a blind spot from being averaged away, but it is a local deployment rule. Start with cheap data and boundary tests, add baselines and important slices, then verify production can detect and recover from failure.
Practice
Return to the lending model. Write one test for each category:
- a data rule for
income, - a model rule for a high-risk customer slice,
- an infrastructure rule for loading the serialized artifact,
- a monitoring rule for a sudden score-distribution shift.
For each, write the failure it would catch and the failure it would miss. That last sentence prevents a test from becoming magical thinking.
A question to carry forward
Serving-parity tests assume that CI and production use the same interpreter, libraries, operating-system behavior, and system packages. A data gate can pass in CI while a dependency parses dates differently or a native library changes a numerical operation.
The next problem is freezing the environment so “passed in CI” relates to “behaves in production.” That is what Docker for ML is for.
Quick check
Practice this in an interview
All questionsBehavioral tests check a model's input-output behavior against expectations rather than just aggregate accuracy, an idea popularized by the CheckList framework. Invariance tests assert that label-preserving perturbations do not change the prediction, directional tests assert a change moves the output the expected way, and minimum-functionality tests are simple cases the model must get right. They catch real-world failures that high overall accuracy can hide.
Unlike traditional software, ML systems need tests across four areas: the data, the model and training, the infrastructure and pipeline, and ongoing monitoring, because behavior depends on data, not just code. Google's ML Test Score is a rubric of 28 actionable tests across those four categories that scores a system's production readiness and technical debt. A low score flags fragile, hard-to-maintain systems even if offline accuracy looks good.
ML CI/CD must validate not just code correctness but also model quality — automated retraining triggers, data validation, model evaluation gates, and canary deployment checks that standard software pipelines have no equivalent for. A regression in model AUC is as much a deployment failure as a 500 error.
Production ML monitoring spans four layers: data quality (schema, distributions, null rates), model behaviour (prediction drift, confidence calibration), operational health (latency, error rate, throughput), and business KPIs (conversion, revenue impact). Each layer has different owners and different alert thresholds.