Orthogonality, projections & least squares
You can't fit noisy data exactly — so you get as close as possible. "As close as possible" is a projection, and the magic is that the leftover error always comes out perpendicular. That single fact is what linear regression is.
What you'll learn
- Orthogonality (dot product = 0) and why an orthonormal basis is a free coordinate system
- Projecting a vector onto a line and onto a subspace
- Why "best approximation" forces the residual to be orthogonal to the model space
- How that derives the normal equations — i.e. how regression is a projection
- QR / Gram–Schmidt as the numerically stable way to do it
Before you start
The last lesson left us stranded in the most ordinary situation in all of data science:
Ax = b with no exact solution — a hundred noisy points, two knobs, and no line that
threads them all. You cannot solve it. So you stop demanding exact and start asking for
closest — and, as promised, “closest” has a clean, exact, almost magical answer, built
entirely out of a single idea: the right angle.
Orthogonality: the cleanest relationship
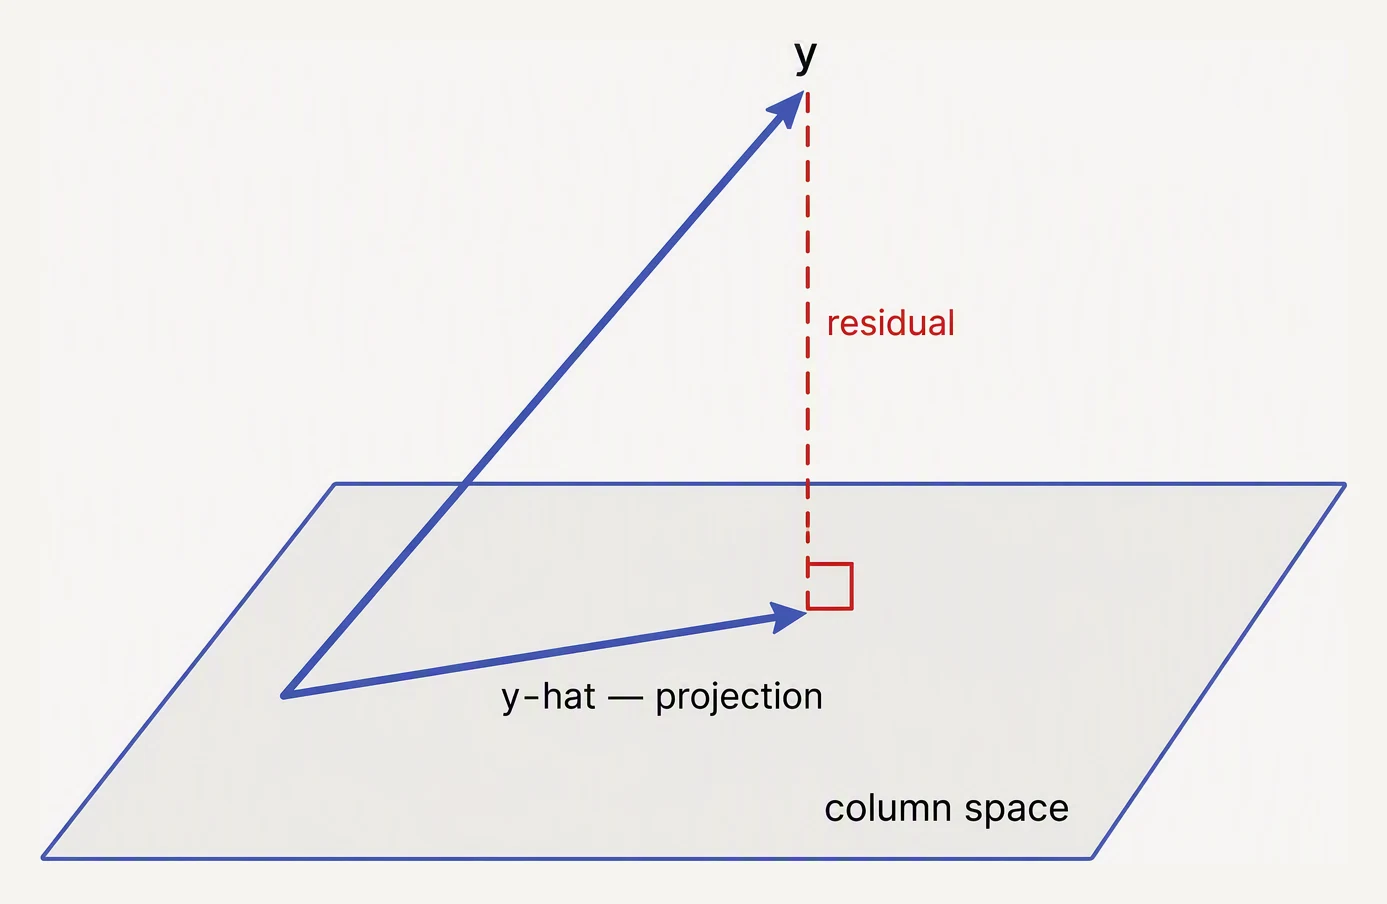
Least squares is a projection — the residual is orthogonal to everything you can fit.
Two vectors are orthogonal when their dot product is zero — they share nothing, they’re perpendicular. A basis of mutually orthogonal unit vectors is orthonormal, and it’s the nicest coordinate system there is: to find a point’s coordinate along an axis, you just take a dot product. No matrix inverse, no solving — orthogonality makes the bookkeeping vanish.
Projection: the closest reachable point
Your model can only produce points in a certain space (a line, a plane, the
column space of X). The target b usually sits outside it. The
projection p is the point inside the model space closest to b:
project b onto the line through a: p = (aᵀb / aᵀa) · aHere’s the whole secret — drag it and watch:
p is the closest point on the line to b. The error b − p is perpendicular to the line — that's the least-squares condition.
Drag b (the target) or a (the model's direction). The residual stays orthogonal to the model space — always.
The error b − p is always perpendicular to the model space. That’s not
a coincidence — it’s why p is closest. If the error had any component
along the model space, you could slide p and get closer. So at the
minimum, the residual is orthogonal to everything the model can represent.
That orthogonality is the normal equations
For regression, the model space is the column space of X, and we want x
so that Xx is the projection of y. “Residual orthogonal to every
column” means:
Xᵀ (y − X x) = 0 ⟹ (XᵀX) x = Xᵀ yThe normal equations — the same linear system from the RREF lesson —
fall straight out of the orthogonality condition. Linear regression is
literally the projection of y onto the span of your features.
import numpy as np

rng = np.random.default_rng(1)
X = np.column_stack([np.ones(20), np.linspace(0, 5, 20)])   # intercept + slope
y = 2 + 1.3 * X[:,1] + rng.normal(0, 0.4, 20)               # noisy line

# Least squares = project y onto the column space of X
beta, *_ = np.linalg.lstsq(X, y, rcond=None)
resid = y - X @ beta
print("fitted [intercept, slope]:", beta.round(3))

# The residual is orthogonal to every column of X (that's the whole point)
print("X^T . residual (~ 0):", (X.T @ resid).round(6))
fitted [intercept, slope]: [2.146 1.247]
X^T . residual (~ 0): [0. 0.]We built the data from the line y = 2 + 1.3x plus noise, and least squares recovered [2.146, 1.247] — close, but bent slightly by the noise. The second line is the orthogonality condition holding numerically: the residual has zero dot product with every column of X.
Gram–Schmidt & QR: doing it without blowing up
You could form XᵀX and solve — but that squares the condition number and
loses precision. Instead, Gram–Schmidt orthonormalizes the columns of
X into Q (orthonormal) times R (upper-triangular): X = QR. Then the
least-squares solution is a clean back-substitution, R x = Qᵀ y. It’s what
np.linalg.lstsq and every serious solver actually do.
In one breath
You cannot fit noisy data exactly, so you fit it closest — and “closest” is a projection: the point p in the model’s reachable space nearest the target b.
The defining fact is that the leftover error b − p always comes out perpendicular to that space. If it had any component inside it, you could slide p and get closer.
Write “residual orthogonal to every column of X” as Xᵀ(y − Xβ) = 0 and out drop the normal equations (XᵀX)β = Xᵀy.
So linear regression is the projection of y onto the span of your features. Serious solvers reach for QR / Gram–Schmidt rather than forming XᵀX, because orthonormalising X directly is far more numerically stable.
Practice
Quick check
A question to carry forward
Orthogonality bought us the best fit: project the target onto what the model can reach, and the perpendicular residual guarantees nothing closer exists.
Between this lesson and the last several, we have bent vectors, stretched them, projected them — done very nearly everything one can do to a vector with a matrix.
But there is one question we have never asked from the matrix’s own point of view. A transform sends most vectors off to a new heading. Are there special directions it refuses to turn — vectors that come out of A pointing exactly where they went in, only longer or shorter?
Here is the thread onward: do such unrotated directions always exist? What would it mean to find the handful of directions a matrix merely stretches? And why do those directions — the eigenvectors — turn out to be the hidden skeleton of:
- a covariance matrix,
- PageRank, and
- the stability of every system that feeds its own output back in as the next input?
Practice this in an interview
All questionsUnder full column rank, OLS sets the gradient of the squared-error objective to zero, giving the normal equations and the unique coefficient vector β = (XᵀX)⁻¹Xᵀy. In rank-deficient or numerical settings, use the pseudoinverse or a least-squares solver rather than explicitly forming the inverse.
The usual five assumptions are linearity, independent errors, constant error variance, normal residuals for exact small-sample inference, and no perfect multicollinearity; a technically complete answer also requires zero conditional mean. Each violation harms a different part of OLS: fit and bias, efficiency, standard errors, inference, or coefficient identifiability.
PCA finds the orthogonal directions of maximum variance in the data and projects onto a lower-dimensional subspace, reducing features while retaining most information. It is most useful before distance-based models or when training is bottlenecked by dimensionality. Its main limits are loss of interpretability, sensitivity to scale, and an assumption of linear structure.
Use gradient descent when the feature matrix is too wide, sparse, or continuously arriving for a direct least-squares solve to fit comfortably in memory, and use mini-batch or stochastic updates when you need online learning. For a modest, fixed, well-conditioned dense dataset, a direct solver is usually simpler and faster; there is no universal feature-count cutoff.