Maximum likelihood & MAP: where loss functions come from
Why is the loss for regression squared error, and for classification cross-entropy? Both fall out of one principle — maximum likelihood — and adding a prior turns it into MAP, which is exactly what regularization is. This is the bridge from probability to training.
What you'll learn
- Likelihood vs probability, and the MLE principle: pick θ that makes the data most probable
- Why Gaussian errors make maximum likelihood equal to minimizing squared error (MSE)
- Why classification's cross-entropy loss is just the negative log-likelihood
- MAP = MLE + a prior, and how that prior is exactly L2 / L1 regularization
- That almost every loss you train with is a disguised negative log-likelihood
Before you start
For five lessons we have been quietly cheating. Every formula — the sample mean x̄, the sample
proportion p̂ = clicks/n, the variance, the standard error built on top of them — began by
plugging in “the obvious” estimate, as if no other number could possibly stand in for the truth.
The last lesson finally caught us and asked the question we kept dodging: why is the sample
proportion the right estimate of p? What principle hands you that formula and not some other?
Here is the principle, and it is one of the most unifying ideas in all of machine learning: maximum likelihood. It does two jobs at once. It explains where those “obvious” estimators come from — and, as a bonus you did not ask for, it explains where your loss functions come from. Mean squared error, cross-entropy: not arbitrary recipes handed down by tradition, but consequences. Once you see it, training stops being a bag of tricks and becomes a single idea wearing different clothes.
The likelihood principle
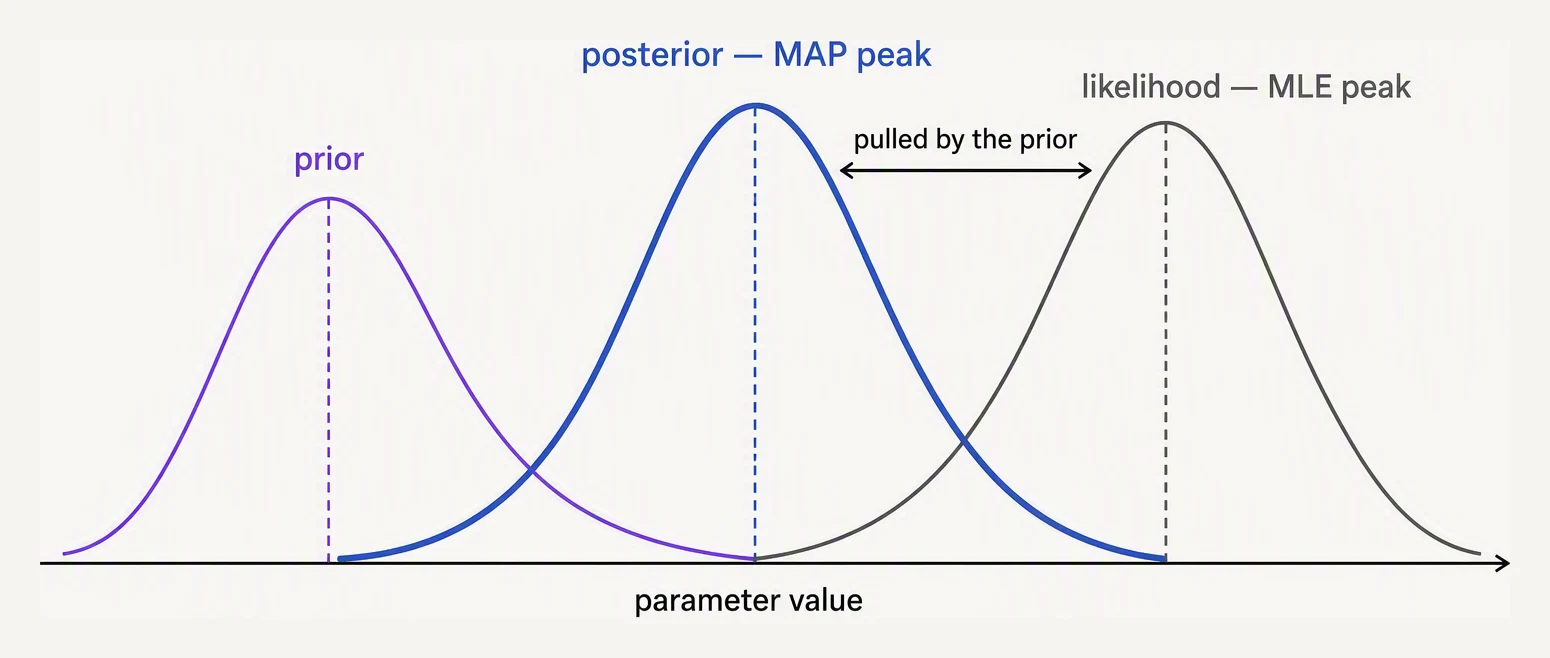
MAP is MLE with a prior pulling the answer toward what you already believed.
Flip the usual question around. Probability asks: given the model, how likely is this data? Maximum likelihood asks the inverse: which model parameters make the data I actually observed the most probable? Call that quantity the likelihood:
L(θ) = P(data | θ) = ∏ᵢ p(xᵢ | θ)A product of hundreds of tiny probabilities underflows to zero on any real computer, so we work with
the log-likelihood instead — a sum is gentler, and the log is monotonic so the maximiser is
unchanged:
θ* = argmax Σᵢ log p(xᵢ | θ)That is the whole principle: turn the knobs θ until the data you saw becomes as unsurprising as it
can be. Slide the mean and spread below and watch where the log-likelihood peaks.
Maximize the log-likelihood and you land on μ = the sample mean, σ = the sample spread. The prior tugs the estimate toward 0 — that pull is regularization.
The maximum lands exactly at μ = the sample mean and σ = the sample spread. So the “obvious”
estimators were never obvious — they are what maximum likelihood derives for a Gaussian. That
answers the previous lesson’s question in one stroke: p̂ = clicks/n is the MLE of a Bernoulli
rate, and x̄ is the MLE of a Gaussian mean. We were using maximum likelihood all along without
naming it.
Reveal #1: squared error is Gaussian likelihood
Now the bonus. Assume your regression targets are the true function plus Gaussian noise:
y = f(x) + ε, with ε ~ N(0, σ²). Write down the log-likelihood, and the exponent of the
Gaussian (−(residual)²/2σ²) drops straight out:
log L = −(1/2σ²) Σ (yᵢ − f(xᵢ))² + constMaximising that is identical to minimising Σ(yᵢ − f(xᵢ))² — the sum of squared errors. Read
that again: MSE is not a design choice. It is what you get the moment you assume Gaussian noise.
Pick squared error and you have silently declared “my errors are bell-shaped.”
Reveal #2: cross-entropy is classification likelihood
The same trick, a different distribution. For a binary label with predicted probability p, each
example contributes p when the label is 1 and 1−p when it is 0 — a Bernoulli likelihood,
p^y (1−p)^{1−y}. Take its negative log:
−[ y log p + (1−y) log(1−p) ]That is exactly binary cross-entropy. The multi-class version is the categorical likelihood. Cross-entropy was never a separate invention — it is the negative log-likelihood of a classifier, and we will meet it again next lesson from the information-theory side.
MAP: maximum likelihood meets a prior
What if you hold a belief about the parameters before the data arrives — say, “the weights should
be small”? Encode that belief as a prior P(θ) and maximise the posterior instead of the
bare likelihood (this is Bayes’ rule, turned into an optimisation):
θ_MAP = argmax  [ Σ log p(xᵢ | θ)  +  log P(θ) ]
                  └ likelihood ┘      └ prior ┘
The prior simply adds a term to the objective. And here is the punchline that ties a bow on the whole calculus chapter:
- A Gaussian prior on the weights adds
λ‖w‖²→ L2 / ridge regularisation. - A Laplace prior adds
λ‖w‖₁→ L1 / lasso regularisation.
Regularisation is MAP estimation. The penalty you bolt onto a loss is literally a prior belief
about the weights, and the strength λ is how strongly you hold it. Drop the prior (or make it
flat) and MAP collapses back to plain MLE.
import numpy as np

rng = np.random.default_rng(0)
data = rng.normal(2.0, 1.3, 200)

# Gaussian MLE has a closed form: the sample mean and sample std
print("MLE μ =", data.mean().round(3), " MLE σ =", data.std().round(3))

# MSE minimizer = MLE under Gaussian noise. Fit y = a + b x by least squares:
x = np.linspace(0,5,200); y = 1 + 2*x + rng.normal(0,0.5,200)
b, a = np.polyfit(x, y, 1)
print("least-squares slope/intercept:", round(b,3), round(a,3), " (this IS the Gaussian MLE)")
MLE μ = 2.02 MLE σ = 1.25
least-squares slope/intercept: 2.009 0.933 (this IS the Gaussian MLE)The data was drawn from N(2.0, 1.3), and the closed-form MLE recovers μ ≈ 2.02, σ ≈ 1.25 — the
sample mean and sample spread, exactly as the principle predicts. The least-squares line recovers
the true slope 2 and intercept ≈ 1, because fitting a line by squared error is maximum likelihood
under Gaussian noise. Two different-looking computations, one principle underneath.
In one breath
Maximum likelihood picks the parameters θ that make the observed data most probable —
maximise Σ log p(xᵢ|θ) (logs turn the underflowing product into a sum). It is the principle behind
every “obvious” estimator: the sample mean is the Gaussian-mean MLE, p̂ = clicks/n the Bernoulli
MLE. It also manufactures loss functions: assume Gaussian noise and maximising likelihood is
minimising MSE; assume Bernoulli/categorical labels and the negative log-likelihood is
cross-entropy. Add a prior P(θ) and you maximise the posterior — MAP — whose extra
log P(θ) term is exactly regularisation: a Gaussian prior gives L2/ridge λ‖w‖², a Laplace
prior gives L1/lasso λ‖w‖₁. Choosing a loss is choosing a noise model; choosing a regulariser is
choosing a prior.
Practice
Quick check
A question to carry forward
Look hard at the object we maximised: Σ log p(xᵢ|θ). Everything turned on that log, and we
treated it as a mere convenience — a trick to stop products underflowing. But it is far more than
bookkeeping. Flip the sign and −log p(x) is a quantity with meaning: it is large when the model
finds x surprising and small when x is expected. Minimising negative log-likelihood is
minimising total surprise. And cross-entropy — the classification loss we just derived — wore
that word openly.
So here is the thread onward. What is −log p, really? If it measures the surprise of a single
outcome, what is its average over a whole distribution — and why is that average, called
entropy, the genuine floor on how many bits it takes to encode a source? Why does
minimising cross-entropy mean minimising wasted bits relative to the truth, and how does this
one currency — information — end up paying for classification losses, decision-tree splits, and the
way we compare two distributions at all?
Practice this in an interview
All questionsMLE maximises the likelihood of the data alone; MAP (Maximum A Posteriori) adds a prior over parameters and maximises the posterior, making it equivalent to regularised MLE. Frequentists treat parameters as fixed unknowns; Bayesians treat them as random variables with a prior distribution.
Use cross-entropy by default because it is the negative log-likelihood for predicted class probabilities and gives a stronger error signal than MSE when a sigmoid or softmax classifier is confidently wrong. MSE can work, but its extra activation-saturation factor often makes classification training slower and less effective.
Log loss (cross-entropy loss) measures how well a model's predicted probabilities match the true labels: it is the negative log-likelihood of the correct class. It penalises confident wrong predictions severely because log(p) approaches negative infinity as p approaches zero — predicting 0.99 for the wrong class incurs roughly 100x the penalty of predicting 0.6 for the wrong class. A perfect model achieves 0; a random binary classifier achieves ln(2) ≈ 0.693.
Logistic regression minimizes binary cross-entropy, also called log-loss, which is the negative log-likelihood of Bernoulli labels under sigmoid-transformed linear predictions. Its Hessian is XᵀSX and is positive semi-definite, so the objective is convex, although a unique finite minimum is not guaranteed without suitable rank, data, or regularization conditions.